| Issue |
A&A
Volume 619, November 2018
|
|
|---|---|---|
| Article Number | L8 | |
| Number of page(s) | 8 | |
| Section | Letters to the Editor | |
| DOI | https://doi.org/10.1051/0004-6361/201834082 | |
| Published online | 20 November 2018 | |
Letter to the Editor
New ultra-cool and brown dwarf candidates in Gaia DR2⋆
Institut UTINAM, CNRS UMR6213, Univ. Bourgogne Franche-Comté, OSU THETA Franche-Comté-Bourgogne, Observatoire de Besançon, 1615, 25010
Besançon Cedex, France
e-mail [email protected]
Received:
13
August
2018
Accepted:
12
September
2018
Context. The second Gaia data release (Gaia DR2) contains high-precision positions, parallaxes, and proper motions for 1.3 billion sources. The resulting Hertzsprung–Russel diagram reveals fine structures throughout the mass range.
Aims. This paper aims to investigate the content of Gaia DR2 at the low-mass end and to characterize ultra-cool and brown dwarfs. Methods. We first retrieved the sample of spectroscopically confirmed ultra-cool and brown dwarfs in Gaia DR2. We used their locus in the precise Hertzsprung–Russel diagram to select new candidates and to investigate their properties.
Results. The number of spectroscopically confirmed objects recovered in Gaia DR2 corresponds to 61% and 74% of the expected number of objects with an estimated Gaia magnitude G est ≤ 21.5 and 20.3, respectively. This fills much of the gap to Gaia DR1. Furthermore, Gaia DR2 contains Ȉ13 000 ≥ M7 and 631 new L candidates. A tentative classification suggests that a few hundred of them are young or subdwarf candidates. Their distance distribution shows that the solar neighborhood census is still incomplete.
Conclusions. Gaia DR2 offers a great wealth of information on low-mass objects. It provides a homogeneous and precise catalog of candidates that is worthwhile to be further characterized with spectroscopic observations.
Key words: stars: low-mass / solar neighborhood / Galaxy: stellar content / surveys / catalogs
Full Table 2 is only available at the CDS via anonymous ftp to cdsarc.u-strasbg.fr (130.79.128.5) or via http://cdsarc.u-strasbg.fr/viz-bin/qcat?J/A+A/619/L8
© ESO 2018
1. Introduction
The Gaia mission (Gaia Collaboration 2016b) provides fullsky coverage down to the Gaia magnitude G = 20(V ≃ 20−22) at the spatial resolution of the HST, with about 70 observations per source over five years. Distances, with an amazing precision of 1% up to 2.5 kpc at the end of the mission, and proper motions are now measured for 1.3 billions stars.
As highlighted in the scientific demonstration paper from (Gaia Collaboration 2018a), Gaia astrometry and photometry are powerful tools for studying fine structures within the Hertzsprung–Russell (HR) diagram. It is now possible to distinguish the locus of different types of objects, as predicted by models.
The Gaia optical observations are not the most suitable observations for studying the low-mass reddest end of the HR diagram. Nevertheless, the large number of objects observed with an unprecedented precision, including trigonometric parallax, makes it an unrivaled dataset for studying the ultra-cool and brown dwarfs.
These low-mass objects are the dominant stellar component of the Milky Way (Ȉ70% of all stars, Reid & Gizis 1997; Bochanski et al. 2010). They still remain elusive, however, because of their low luminosity, and modeling their complex atmosphere is still a challenge. Therefore, the understanding of this population has relevant implications for both stellar and Galactic astronomy.
Ultra-cool dwarfs have been defined by Kirkpatrick et al. (1997) as M7 and later main-sequence stars. This corresponds to an effective temperature of ≲2700 K (Rajpurohit et al. 2013). These objects serve as a link between known stars and brown dwarfs. They span the transition from stellar to sub-stellar masses: this effective temperature is expected in a 0.03 M ⊙ object of 8 Myr or in a 0.095 M ⊙ object of 10 Gyr (Baraffe et al. 2015), both at solar metallicity.
Smart et al. (2017) compiled an input catalog of known L and T dwarfs with an estimated G magnitude within the reach of Gaia. They identified part of them in Gaia DR1 (Gaia Collaboration 2016a). They found 321 L and T dwarfs, with 10 ≥ L7, which corresponds to 45% of the brown dwarfs with estimated Gaia magnitude G est ≤ 20.3. As they pointed out, this incompleteness is mainly due to the cuts made in the catalog to ensure the quality of the data. With eight more months of observations, Gaia DR2 (Gaia Collaboration 2018b) should provide more complete and precise data, and help to fill this gap. Recent discoveries show that even the local census is not complete, as illustrated by the discovery of an L7 at 11 pc, close to the Galactic plane (Scholz & Bell 2018; Faherty et al. 2018).
In a first step, we search for known ultra-cool and brown dwarfs in Gaia DR2 and investigate their properties using their Gaia observations (Sect. 2). In a second step, we use the properties from the known sample to show the potential of Gaia DR2 to reveal new candidates and list them (Sect. 3). The conclusions and perspectives are given in Sect. 4.
2. Known ultra-cool and brown dwarfs found in Gaia DR2
2.1. Sample
We focus on the well-characterized sample of ultra-cool and brown dwarfs that have a spectroscopic spectral type. A compilation of all L, T , and Y dwarfs that Gaia is expected to observe directly or constrain indirectly (e.g., in a common proper motion system with brighter members), the so-called Gaia Ultracool Dwarf Sample (GUCDS), has been published by Smart et al. (2017). GUCDS is based on the online census compiled by J. Gagné1, which contains all objects from the Dwarfarchives2 database, complemented by the catalogs of Dupuy & Liu (2012) and Mace (2014). Some of these objects have information on age or metallicity, and they are listed in the census as young candidates or subdwarfs. Smart et al. (2017) added the recent discoveries from Marocco et al. (2015) and Faherty et al. (2016). This catalog has 1886 entries, for which the predicted G magnitude is brighter than 21.5 for 1010 L and 58 T dwarfs. This is within the reach of Gaia.
To this census, we added the ultra-cool (M7–M9.5) dwarfs listed by J. Gagné3 and the new spectroscopically confirmed objects from (Rajpurohit et al. 2014; Robert et al. 2016; Faherty et al. 2018; Zhang et al. 2018). Because we wish to study the location in the fine Gaia DR2 HR diagram of a well-characterized sample, we did not include the numerous candidates that are found in photometric surveys without spectroscopic confirmation.
We retrieved these entries using their 2MASS identifier and cross-matching Gaia DR2 with the 2MASS catalog (Skrutskie et al. 2006) provided in the Gaia archive (Marrese et al. 2017). We also used the Gaia DR2 identifier when available in the SIMBAD astronomical database4 (Wenger et al. 2000), particularly for the faint objects found within the SDSS (Eisenstein et al. 2011) and SIMPS (Artigau et al. 2009) catalogs that have no counterpart in 2MASS.
The resulting sample includes 3671 ultra-cool (≥M7), 647 L, and 16 T dwarfs, 34 of which have a spectral type ≥L7. Of these, 1806 ≥ M7, 526 L, and 9 T dwarfs have a relative precision on parallax σ ϖ ≤ 10%, and full astrometric (coordinates, parallax, and proper motions) and photometric (G, G BP, and G RP) information. Twenty-six are noted in the census as subdwarfs and 75 as young candidates. The spectral type distribution of the input catalog, the sample with an entry in Gaia DR2, and the subsample with σ ϖ ≤ 10% is shown in Fig. 1.
 |
Fig. 1. Spectral type distribution of the known ultra-cool (≥M7) and brown dwarfs. Black line: input catalog. Gray line: objects with a counterpart in Gaia DR2. Filled gray: objects with a counterpart in Gaia DR2 and σ ϖ ≤ 10%. 10 stands for L0, 20 for T0, and 30 for Y0 on the spectral type axis. |
We built the HR diagram by computing the absolute Gaia magnitude in the G band for individual stars using MG = G − 5 log10(1000/ϖ)+5, where ϖ is the parallax in milli-arcseconds. The simple distance determination from ϖ is valid when σ ϖ ≲ 20% (Luri et al. 2018).
Figure 2 shows the HR diagram of the sub-sample with σ ϖ ≤ 10%. The color code gives the spectral type. The adopted spectral type is the mean of the optical and near-infrared spectral type when both are available. We used G−G RP as the color index because these faint and red objects have a lower flux in the BP bandpass.
 |
Fig. 2. HR diagram of the known ultra-cool and brown dwarfs found in Gaia DR2 that have σ ϖ ≤ 10%. The color bar gives the spectral type range, where 10 stands for L0 and 20 for T0. |
As the sub-sample with σ
ϖ
≤ 10% contains all astrometric properties, it allows us to explore the HR diagram as a function of transverse velocity. The transverse velocity V
T was computed as follows:  , where μ
α
and μ
δ
are the proper motions. This is shown in Fig. 3. Thanks to the high precision of Gaia measurements, it is possible to distinguish a sequence of young candidates (redder and brighter) with a low transverse velocity from the sequence of lower metallicity dwarfs (bluer and fainter). The vast majority of the subdwarfs have a high transverse velocity, indicating that they belong to the older populations of the Milky Way, as expected. This separation seems slightly enhanced in the G − J color index over the G − G
RP index.
, where μ
α
and μ
δ
are the proper motions. This is shown in Fig. 3. Thanks to the high precision of Gaia measurements, it is possible to distinguish a sequence of young candidates (redder and brighter) with a low transverse velocity from the sequence of lower metallicity dwarfs (bluer and fainter). The vast majority of the subdwarfs have a high transverse velocity, indicating that they belong to the older populations of the Milky Way, as expected. This separation seems slightly enhanced in the G − J color index over the G − G
RP index.
 |
Fig. 3. HR diagram of the known sample found in Gaia DR2 (restricted to the sub-sample with σ ϖ ≤ 10%), using the G − G RP (left panel) and G − J (right panel) color index. The color bar gives the transverse velocity range. Filled squares are objects listed as subdwarfs in the census, and open circles are objects listed as young candidates. |
2.2. Color, absolute magnitude, and spectral type relations
We determined the relationships between MG , MJ , MH , MKs , G − J, J − Ks , and spectral type from a polynomial fitting of the sub-sample (σ ϖ ≤ 10%). We also determined the MJ vs. J − Ks relation. The resulting parameters and their asymptotic standard errors are summarized in Table 1. The validity range of each relation is also given. Some of the relations are shown in Fig. 4.
Colors, absolute magnitudes, and spectral type relations obtained from the polynomial fitting Y = aX 2 + bX + c.
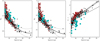 |
Fig. 4. MG (left panel), MJ (middle panel), and G − J (right panel) relations vs. spectral type of the known ultra-cool and brown dwarfs found in Gaia DR2. 10 stands for L0, and 20 for T0. The squares show the subdwarfs, and the open circles the young candidates. The black line gives the fits, and the gray lines include the asymptotic standard errors. The G − J vs. spectral type relation is valid from M7 to L9). The black dashed line is the relation derived from L0 to L7 found in Gaia DR1 (Smart et al. 2017). |
The dashed line in the right panel of Fig. 4 represents the relation derived from 304 L dwarfs found in Gaia DR1 (Smart et al. 2017). The difference is due to the evolution of the photometric system between Gaia DR1 and Gaia DR2, as described in Gaia Collaboration (2018b).
Young candidates depart from these relationships, in particular in the M-dwarf regime. It is also possible to distinguish the relation followed by the subdwarfs. Such trends have been presented extensively in different photometric systems by Zhang et al. (2018) based on their sample of 20 L subdwarfs found in Gaia DR2.
3. New ultra-cool and brown dwarf candidates in Gaia DR2
Our aim is to search for robust candidates in Gaia DR2, in particular, to define a list of objects deserving further investigations such as spectroscopic follow-up. Thus we chose to apply strict filters on the data that were based on astrometric and photometric features. Detailed information on the data processing, validation, and catalog content are given by Lindegren et al. (2018) for the astrometry and by Riello et al. (2018) and Evans et al. (2018) for the photometry. The global validation of the catalog can be found in Arenou et al. (2018), and the description of the Gaia archive5 in Salgado et al. (2018).
3.1. Data filtering
In order to work on a precise HR diagram, we followed Gaia Collaboration (2018a) to filter the data. We refer to this paper for a detailed description of the applied filters. Here we describe their effects only briefly. The Gaia Collaboration retained objects with σ M G < 0.22 mag, σ G < 0.022 mag, σ G RP < 0.054 mag, and reliable five-parameter solutions (astrometric and photometric), and removed most artifacts.
The corresponding Gaia archive query is
SELECT * FROM gaiadr2.gaia_source
WHERE parallax_over_error > 10
AND phot_g_mean_flux_over_error>50
AND phot_rp_mean_flux_over_error>20
AND visibility_periods_used>8
AND astrometric_chi2_al/(astrometric_n_good_obs_al-5)
<1.44*greatest(1,exp(-0.4*(phot_g_mean_mag-19.5)))
Following Gaia Collaboration (2018a), we also restricted the sample to low-extinction regions in the Milky Way and kept objects with a reddening E(B − V) ≤ 0.015 according to the 3D extinction map of Capitanio et al. (2017). The resulting HR diagram is shown in the left panel of Fig. 5.
 |
Fig. 5. HR diagram of Gaia DR2. Left panel: 4 705 366 stars, after filtering, and in low-extinction Galactic regions. Middle panel: 4 640 635 stars, after removing stars with an RP/BP flux excess following Evans et al. (2018). Right panel: 3 716 407 stars with the 2MASS photometric quality flag Q fl = AAA, and after removing stars showing color excess using G − J (see text). |
3.2. Color excess
The HR diagram has a fuzzy appearance between the white dwarfs and the main sequence, and redward of the main sequence. Whereas the G flux is determined from a profile fitting, the fluxes in the blue (BP) and red (RP) photometers are the total flux in a field of 3.5 × 2,1 arcsec2. Therefore, the measured BP and RP fluxes may include a contribution of flux from bright sky background (e.g., in crowded regions or from a nearby source). As explained in Evans et al. (2018), IG , I BP, and I RP, the flux in the G, G BP, and G RP bandpass, respectively, should be consistent (the sum of the BP and RP fluxes is expected to exceed the G flux by only a small factor). They defined the color excess factor phot_bp_rp_excess_factor = (IBP + IRP)/IG and an empirical limit to reject the affected sources having phot_bp_rp_excess_factor ≥ 1.3 + 0.06 × (G BP − G RP)2.
The resulting HR diagram when applying this filter is shown in the middle panel of Fig. 5. Because ultra-cool and brown dwarfs have low flux in the BP bandpass, they are very sensitive to any background overestimation yielding a high phot_bp_rp_excess_factor. As a consequence, most of these objects are rejected, as can be clearly seen at the low-mass end of the main sequence. As an illustration, applying this filter on the previously known sample dramatically removes 47% of the objects (68% of the L and T dwarfs) that were found in Gaia DR2 (1067 ultra-cool and only 160 L dwarfs remain).
It is thus necessary to define a more suitable criterion to retain these faint and red objects that does not rest upon the BP flux. The effect of color excess is also clearly visible in the G − J vs. G − G RP plane (Fig. 6, left panel). We define a new empirical limit, shown by the curve in the plot:

 |
Fig. 6. G−J vs. G−G RP diagram at the low-mass end. The open triangles show previously known objects found in Gaia DR2 (see Sect. 2). The dots show the filtered Gaia DR2 catalog with a 2MASS counterpart and a 2MASS photometric quality flag Q fl = AAA, before (left panel), and after (right panel) removing objects with an RP/BP flux excess following Evans et al. (2018). The curve shows the empirical limit we used to filter objects with spurious colors. |
We note that the J magnitude rejects ~20% of the candidates with no 2MASS counterpart or a 2MASS photometric quality flag Q fl ≠ AAA. Removing objects below this limit allows excluding objects with spurious colors, but the low-mass objects can still be retained, as well as most of the previously known sample. This is in contrast to the cut using the color excess factor (Fig. 6, right panel). The resulting HR diagram is shown in the right panel of Fig. 5.
As the rejection of objects is based on a hard and empirical cutoff, we expect our sample to be contaminated, in particular for G − G RP ≲ 1.6 (see left panel of Fig. 6). About 12% of our sample with G − G RP ≲ 1.6 indeed have a color-excess factor above the limit defined by Evans et al. (2018). This is much less an issue for L candidates (G − G RP ≳ 1.6).
3.3. Selecting ultra-cool and brown dwarf candidates
Figure 7 focuses on the Gaia DR2 HR diagram at the low-mass end, superimposed with the sample of spectroscopically confirmed ultra-cool and brown dwarfs found in Gaia DR2.
 |
Fig. 7. M G vs. G − J diagram of the filtered Gaia DR2 catalog (gray dots) at the low-mass end, superimposed on the known spectroscopic sample. Left panel: color-code gives the spectral type (10 stands for L0 and 20 for T0) and allows defining three regions, separated by the solid lines, from top to bottom: ≲M7, ~M7 to L0, and ≳L0. Right panel: squares represent the known subdwarfs, and open circles show the young candidates. The dashed lines aim to separate these different types. |
We used the information on the spectral type to define separations in the HR diagram. They are shown by solid lines and suggest that Gaia DR2 contains 14 176 M7–L0 candidates and 488 L candidates, all of them earlier than L5. These indicative numbers exclude previously known objects in common that remained after we applied the filters described in the previous section (870 M7–L0 and 223 L dwarfs).
Because the very end on the main sequence is less affected by the color excess problem, we also selected L candidates from the MG vs. G − G RP diagram. The selection was defined from the locus of the spectroscopically confirmed sample (MG > 17.5 − (G − G RP), and 1.55 < G RP < 1.85). It allowed us to retrieve robust candidates that do not depart from the main sequence. These 251 additional candidates would have been excluded based on lack of J magnitude (or a bad 2MASS photometric quality flag Q fl).
We also used the peculiarities of the known sample to tentatively define regions where subdwarfs and young candidates are expected to be dominant. We used the G − J color index as it better separates these types (right panel in Fig. 7, also visible in the right panel of Fig. 3), probably because of the larger wavelength extent between the G and J bands. There are 233 (≥M7) and 70 (L) new promising young candidates and 466 (≥M7) and 17 (L) subdwarf candidates. The candidates are listed in a table published at the CDS. A small part is shown in Table 2.
Characteristics of the ultra-cool and brown dwarf candidates found in Gaia DR2.
3.4. Comparison with models
Evolutionary and atmosphere models of ultra-cool and brown dwarfs have been developed for a long time (see, e.g., the 20-year old review from Burrows et al. 1998) and are successful today in reproducing color–magnitude diagrams in many photometric systems.
However, the strong added value of Gaia data in testing these models, that is, the precise parallax, will help refine these models. Here we show a preliminary comparison of our candidates with the new evolutionary models reported by Baraffe et al. (2015) that consistently couple interior structure calculations with the BT-Settl atmosphere models (Allard et al. 2013).
Figure 8 shows the HR diagram of our candidates superimposed on these evolutionary models. They tend to confirm the locus of the objects as a function of the peculiarities we discussed in the previous section. It also shows that our selection does not favor young candidates, as can be seen also in the right panel of Fig. 7.
 |
Fig. 8. BT-Settl evolution tracks from right to left: 0.02, 0.04, 0.06, and 0.08 M ⊙ at [M/H] = 0, and 0.083 M ⊙ at [M/H] = −1. The color bar gives the logarithm of the age in Gyr. The gray dots show the Gaia DR2 candidates. |
3.5. Completing the census
Figure 9 shows the sky distribution of previously known (top) and new candidates (bottom). The new candidates cover the whole sky, including the Galactic plane, where we can expect more discoveries of hidden dwarfs, such as the newly characterized L-dwarf WISE J192512.78+070038.8 (Scholz & Bell 2018; Faherty et al. 2018). The imprint of the Gaia scanning law is visible in the plot, where no candidates are found in some Galactic regions, which are rejected as they do not fulfill our condition visibility_periods_used > 8. Thus new candidates are expected to be found in the forthcoming Gaia data releases.
 |
Fig. 9. Sky distribution in equatorial coordinates of previously known ultra-cool dwarfs with a counterpart in Gaia DR2 (top panel), and of the additional candidates found in the filtered Gaia DR2 data (bottom panel). The dots are ≥M7, the blue open circles are L-dwarfs, and the red squares are T -dwarfs. |
Figure 10 shows the distance distribution of previously known and additional Gaia DR2 candidates for L and ≥ M7 dwarfs. While several recent efforts (see Best et al. 2018a) have been made to complete the volume-limited sample of brown dwarfs up to 25 pc, Gaia shows that the census is still not complete. The situation is even worse for ≥M7 dwarfs, which is not surprising since we here only considered objects with spectroscopic confirmation. The ongoing and future spectroscopic large survey such as APOGEE (Majewski et al. 2017), LAMOST (Cui et al. 2012), WEAVE (Dalton et al. 2014), and 4MOST (de Jong et al. 2016) will soon complete the characterization of the census of sources that lie farther away.
 |
Fig. 10. Distance distribution of the L (left panel) and ≥M7–L0 (right panel) dwarfs for the known sample (black line) and the additional candidates found in the filtered Gaia DR2 data (filled gray). |
4. Conclusion
Smart et al. (2017) estimated the Gaia magnitude from J magnitude and spectral type of spectroscopically confirmed objects and found that 1010 L and 58 T are brighter than G est = 21.5, and 543 L and 10 T are brighter than G est = 20.3. Sarro et al. (2013) predicted similar numbers using a more theoretical approach.
Gaia DR2 contains very many objects of the spectroscopically confirmed sample: 3050 ultra-cool (≥M7), 647 L, and 16 T dwarfs. This corresponds to 61% and 74% objects with G est ≥ 21.5 and G est = ≥20.3, respectively. However, Gaia DR2 is an intermediate release, on which strong filters were applied. Further releases will most probably continue to fill the gap.
There are numerous ultra-cool (~14 200) and mainly early L (739) candidates in Gaia DR2. We stress that these numbers are lower limits because of the successive cuts we made to the original Gaia DR2. In particular, we used the J magnitude to remove objects with a spurious color excess, and ~20% of the objects were rejected during the cross-identification with 2MASS. The high precision of the HR diagram allows us to give an indication of some of the characteristics of the object, for instance, whether it is young or a subdwarf. This rough classification was made to guide the target selection for follow-up, depending on the scientific case that is to be studied.
The given numbers are of course indicative, but they also prove that the census is not complete yet, even locally. Although we call them new candidates, some may be part of the significant number of ultra-cool and brown dwarf candidates found in largescale surveys that have been classified from photometry (e.g., Folkes et al. 2012; Smith et al. 2014, 2018; Schmidt et al. 2015; Skrzypek et al. 2016; Theissen et al. 2017; Best et al. 2018b). We cross-matched these studies and found that 1800 ≥M7 and 108 L dwarfs are indeed part of them. Still, the numerous candidates we found are most valuable for follow-up since they benefit from the reliable Gaia observations, including precise parallax and proper motion.
Further exploitation of this dataset will be useful for completing the census of late-M and at least early-type brown dwarfs, refining their luminosity function, testing stellar and substellar models, and probing the old population in the Galaxy through the few hundred subdwarf candidates. The contamination and completeness of the sample is not easy to address, in particular because of the BP and RP flux measurements, which are contaminates by the background flux. The cyclic nature of the treatment of Gaia offers the promise of a increased quality and a larger quantity of data at each release. In any case, the high precision of Gaia and the numerous candidates it provides with full 5D (astrometry and photometry) data offers a great wealth of information at the low-mass end of the HR diagram. This homogeneous and precise catalog is a worthwhile target to be further characterized with spectroscopic observations, and most likely has surprises in store for us6,7.
Acknowledgments
The author thanks the referee for fruitful comments. This work has made use of data from the European Space Agency (ESA) mission Gaia (https://www.cosmos.esa.int/gaia), processed by the Gaia Data Processing and Analysis Consortium (DPAC, https://www.cosmos.esa.int/web/gaia/dpac/consortium). Funding for the DPAC has been provided by national institutions, in particular the institutions participating in the Gaia Multilateral Agreement. This research has made use of the VizieR catalogue access tool, CDS, Strasbourg, France. The original description of the VizieR service was published in Ochsenbein et al. (2000). This research has made use of the SIMBAD database, operated at CDS, Strasbourg, France. The author made queries at CDS using Virtual Observatory with python (Paletou & Zolotukhin 2014). All figures have been generated using the TOPCAT tool (Taylor et al. 2005). Data fitting was performed using Gnuplot.
References
- Allard, F., Homeier, D., & Freytag, B. 2013, Mem. Soc. Astron. It., 84, 1053 [NASA ADS] [Google Scholar]
- Arenou, F., Luri, X., Babusiaux, C., et al. 2018, A&A, 616, A17 [Google Scholar]
- Artigau, É, Lafrenière, D., & Doyon, R. 2009, AIP Conf. Ser., 1094, 493 [NASA ADS] [CrossRef] [Google Scholar]
- Baraffe, I., Homeier, D., Allard, F., & Chabrier, G. 2015, A&A, 577, A42 [NASA ADS] [CrossRef] [EDP Sciences] [Google Scholar]
- Best, W. M. J., Liu, M. C., Magnier, E., & Dupuy, T. 2018a, AAS Meeting Abstracts, 231, 349.19 [Google Scholar]
- Best, W. M. J., Magnier, E. A., Liu, M. C., et al. 2018b, ApJS, 234, 1 [NASA ADS] [CrossRef] [Google Scholar]
- Bochanski, J. J., Hawley, S. L., Covey, K. R., et al. 2010, AJ, 139, 2679 [NASA ADS] [CrossRef] [Google Scholar]
- Burrows, A., Sudarsky, D., & Sharp, C. 1998, ASP Conf. Ser., 134, 354 [NASA ADS] [Google Scholar]
- Capitanio, L., Lallement, R., Vergely, J. L., Elyajouri, M., & Monreal-Ibero, A. 2017, A&A, 606, A65 [NASA ADS] [CrossRef] [EDP Sciences] [Google Scholar]
- Cui, X.-Q., Zhao, Y.-H., Chu, Y.-Q., et al. 2012, Res. Astron. Astrophys., 12, 1197 [NASA ADS] [CrossRef] [Google Scholar]
- Dalton, G., Trager, S., Abrams, D. C., et al. 2014, Proc. SPIE, 9147, 91470L [Google Scholar]
- de Jong, R. S., Barden, S. C., Bellido-Tirado, O., et al. 2016, Proc. SPIE, 9908, 99081O [CrossRef] [Google Scholar]
- Dupuy, T. J., & Liu, M. C. 2012, ApJS, 201, 19 [NASA ADS] [CrossRef] [Google Scholar]
- Eisenstein, D. J., Weinberg, D. H., Agol, E., et al. 2011, AJ, 142, 72 [Google Scholar]
- Evans, D. W., Riello, M., De Angeli, F., et al. 2018, A&A, 616, A4 [NASA ADS] [CrossRef] [EDP Sciences] [Google Scholar]
- Faherty, J. K., Riedel, A. R., Cruz, K. L., et al. 2016, ApJS, 225, 10 [NASA ADS] [CrossRef] [Google Scholar]
- Faherty, J. K., Gagne, J., & Burgasser, A. J. 2018, ApJL, submitted [arXiv:1805.01573] [Google Scholar]
- Folkes, S. L., Pinfield, D. J., Jones, H. R. A., et al. 2012, MNRAS, 427, 3280 [NASA ADS] [CrossRef] [Google Scholar]
- Gaia Collaboration (Brown, A. G. A., et al.) 2016a, A&A, 595, A2 [NASA ADS] [CrossRef] [EDP Sciences] [Google Scholar]
- Gaia Collaboration (Prusti, T., et al.) 2016b, A&A, 595, A1 [NASA ADS] [CrossRef] [EDP Sciences] [Google Scholar]
- Gaia Collaboration (Babusiaux, C., et al.) 2018a, A&A, 616, A10 [NASA ADS] [CrossRef] [EDP Sciences] [Google Scholar]
- Gaia Collaboration (Brown, A. G. A., et al.) 2018b, A&A, 616, A1 [NASA ADS] [CrossRef] [EDP Sciences] [Google Scholar]
- Kirkpatrick, J. D., Henry, T. J., & Irwin, M. J. 1997, AJ, 113, 1421 [NASA ADS] [CrossRef] [Google Scholar]
- Lindegren, L., Hernández, J., Bombrun, A., et al. 2018, A&A, 616, A2 [NASA ADS] [CrossRef] [EDP Sciences] [Google Scholar]
- Luri, X., Brown, A. G. A., Sarro, L. M., et al. 2018, A&A, 616, A9 [NASA ADS] [CrossRef] [EDP Sciences] [Google Scholar]
- Mace, G. N. 2014, PhD thesis, University of California, Los Angeles, USA [Google Scholar]
- Majewski, S. R., Schiavon, R. P., Frinchaboy, P. M., et al. 2017, AJ, 154, 94 [NASA ADS] [CrossRef] [Google Scholar]
- Marocco, F., Jones, H. R. A., Day-Jones, A. C., et al. 2015, MNRAS, 449, 3651 [NASA ADS] [CrossRef] [Google Scholar]
- Marrese, P. M., Marinoni, S., Fabrizio, M., & Giuffrida, G. 2017, A&A, 607, A105 [NASA ADS] [CrossRef] [EDP Sciences] [Google Scholar]
- Ochsenbein, F., Bauer, P., & Marcout, J. 2000, A&AS, 143, 23 [NASA ADS] [CrossRef] [EDP Sciences] [Google Scholar]
- Paletou, F., & Zolotukhin, I. 2014, ArXiv e-prints [arXiv:1408.7026] [Google Scholar]
- Rajpurohit, A. S., Reylé, C., Allard, F., et al. 2013, A&A, 556, A15 [NASA ADS] [CrossRef] [EDP Sciences] [Google Scholar]
- Rajpurohit, A. S., Reylé, C., Allard, F., et al. 2014, A&A, 564, A90 [NASA ADS] [CrossRef] [EDP Sciences] [Google Scholar]
- Reid, I. N., & Gizis, J. E. 1997, AJ, 114, 1992 [NASA ADS] [CrossRef] [Google Scholar]
- Riello, M., De Angeli, F., Evans, D. W., et al. 2018, A&A, 616, A3 [NASA ADS] [CrossRef] [EDP Sciences] [Google Scholar]
- Robert, J., Gagné, J., Artigau, É., et al. 2016, ApJ, 830, 144 [NASA ADS] [CrossRef] [Google Scholar]
- Salgado, J., González-Núñez, J., & Gutiérrez-Sánchez, R. 2018, Gaia DR2 Documentation Chapter 13: Construction of the Archive, Tech. Rep. [Google Scholar]
- Sarro, L. M., Berihuete, A., Carrión, C., et al. 2013, A&A, 550, A44 [NASA ADS] [CrossRef] [EDP Sciences] [Google Scholar]
- Schmidt, S. J., Hawley, S. L., West, A. A., et al. 2015, AJ, 149, 158 [NASA ADS] [CrossRef] [Google Scholar]
- Scholz, R.-D., & Bell, C. P. M. 2018, Res. Notes Am. Astron. Soc., 2, 33 [NASA ADS] [CrossRef] [Google Scholar]
- Skrutskie, M. F., Cutri, R. M., Stiening, R., et al. 2006, AJ, 131, 1163 [NASA ADS] [CrossRef] [Google Scholar]
- Skrzypek, N., Warren, S. J., & Faherty, J. K. 2016, A&A, 589, A49 [NASA ADS] [CrossRef] [EDP Sciences] [Google Scholar]
- Smart, R. L., Marocco, F., Caballero, J. A., et al. 2017, MNRAS, 469, 401 [NASA ADS] [CrossRef] [Google Scholar]
- Smith, L., Lucas, P. W., Bunce, R., et al. 2014, MNRAS, 443, 2327 [NASA ADS] [CrossRef] [Google Scholar]
- Smith, L. C., Lucas, P. W., Kurtev, R., et al. 2018, MNRAS, 474, 1826 [NASA ADS] [CrossRef] [Google Scholar]
- Taylor, M. B. 2005, ASP Conf. Ser., 347, 29 [Google Scholar]
- Theissen, C. A., West, A. A., Shippee, G., Burgasser, A. J., & Schmidt, S. J. 2017, AJ, 153, 92 [NASA ADS] [CrossRef] [Google Scholar]
- Wenger, M., Ochsenbein, F., Egret, D., et al. 2000, A&AS, 143, 9 [NASA ADS] [CrossRef] [EDP Sciences] [Google Scholar]
- Zhang, Z. H., Gálvez-Ortiz, M. C., Pinfield, D. J., et al. 2018, MNRAS, 480, 5447 [NASA ADS] [CrossRef] [Google Scholar]
All Tables
Colors, absolute magnitudes, and spectral type relations obtained from the polynomial fitting Y = aX 2 + bX + c.
All Figures
|
Fig. 1. Spectral type distribution of the known ultra-cool (≥M7) and brown dwarfs. Black line: input catalog. Gray line: objects with a counterpart in Gaia DR2. Filled gray: objects with a counterpart in Gaia DR2 and σ ϖ ≤ 10%. 10 stands for L0, 20 for T0, and 30 for Y0 on the spectral type axis. |
| In the text | |
|
Fig. 2. HR diagram of the known ultra-cool and brown dwarfs found in Gaia DR2 that have σ ϖ ≤ 10%. The color bar gives the spectral type range, where 10 stands for L0 and 20 for T0. |
| In the text | |
|
Fig. 3. HR diagram of the known sample found in Gaia DR2 (restricted to the sub-sample with σ ϖ ≤ 10%), using the G − G RP (left panel) and G − J (right panel) color index. The color bar gives the transverse velocity range. Filled squares are objects listed as subdwarfs in the census, and open circles are objects listed as young candidates. |
| In the text | |
|
Fig. 4. MG (left panel), MJ (middle panel), and G − J (right panel) relations vs. spectral type of the known ultra-cool and brown dwarfs found in Gaia DR2. 10 stands for L0, and 20 for T0. The squares show the subdwarfs, and the open circles the young candidates. The black line gives the fits, and the gray lines include the asymptotic standard errors. The G − J vs. spectral type relation is valid from M7 to L9). The black dashed line is the relation derived from L0 to L7 found in Gaia DR1 (Smart et al. 2017). |
| In the text | |
|
Fig. 5. HR diagram of Gaia DR2. Left panel: 4 705 366 stars, after filtering, and in low-extinction Galactic regions. Middle panel: 4 640 635 stars, after removing stars with an RP/BP flux excess following Evans et al. (2018). Right panel: 3 716 407 stars with the 2MASS photometric quality flag Q fl = AAA, and after removing stars showing color excess using G − J (see text). |
| In the text | |
|
Fig. 6. G−J vs. G−G RP diagram at the low-mass end. The open triangles show previously known objects found in Gaia DR2 (see Sect. 2). The dots show the filtered Gaia DR2 catalog with a 2MASS counterpart and a 2MASS photometric quality flag Q fl = AAA, before (left panel), and after (right panel) removing objects with an RP/BP flux excess following Evans et al. (2018). The curve shows the empirical limit we used to filter objects with spurious colors. |
| In the text | |
|
Fig. 7. M G vs. G − J diagram of the filtered Gaia DR2 catalog (gray dots) at the low-mass end, superimposed on the known spectroscopic sample. Left panel: color-code gives the spectral type (10 stands for L0 and 20 for T0) and allows defining three regions, separated by the solid lines, from top to bottom: ≲M7, ~M7 to L0, and ≳L0. Right panel: squares represent the known subdwarfs, and open circles show the young candidates. The dashed lines aim to separate these different types. |
| In the text | |
|
Fig. 8. BT-Settl evolution tracks from right to left: 0.02, 0.04, 0.06, and 0.08 M ⊙ at [M/H] = 0, and 0.083 M ⊙ at [M/H] = −1. The color bar gives the logarithm of the age in Gyr. The gray dots show the Gaia DR2 candidates. |
| In the text | |
|
Fig. 9. Sky distribution in equatorial coordinates of previously known ultra-cool dwarfs with a counterpart in Gaia DR2 (top panel), and of the additional candidates found in the filtered Gaia DR2 data (bottom panel). The dots are ≥M7, the blue open circles are L-dwarfs, and the red squares are T -dwarfs. |
| In the text | |
|
Fig. 10. Distance distribution of the L (left panel) and ≥M7–L0 (right panel) dwarfs for the known sample (black line) and the additional candidates found in the filtered Gaia DR2 data (filled gray). |
| In the text | |
Current usage metrics show cumulative count of Article Views (full-text article views including HTML views, PDF and ePub downloads, according to the available data) and Abstracts Views on Vision4Press platform.
Data correspond to usage on the plateform after 2015. The current usage metrics is available 48-96 hours after online publication and is updated daily on week days.
Initial download of the metrics may take a while.