| Issue |
A&A
Volume 626, June 2019
|
|
|---|---|---|
| Article Number | A104 | |
| Number of page(s) | 22 | |
| Section | Galactic structure, stellar clusters and populations | |
| DOI | https://doi.org/10.1051/0004-6361/201935609 | |
| Published online | 20 June 2019 | |
The LOFAR Tied-Array All-Sky Survey (LOTAAS): Survey overview and initial pulsar discoveries
1
Anton Pannekoek Institute for Astronomy, University of Amsterdam, Postbus 94249, 1090 GE Amsterdam, The Netherlands
2
Jodrell Bank Centre for Astrophysics, School of Physics and Astronomy, University of Manchester, Manchester M13 9PL, UK
3
ASTRON, The Netherlands Institute for Radio Astronomy, Oude Hoogeveensedijk 4, 7991 PD Dwingeloo, The Netherlands
e-mail: [email protected]
4
Astro Space Centre, Lebedev Physical Institute, Russian Academy of Sciences, Profsoyuznaya Str. 84/32, Moscow 117997, Russia
5
Department of Physics, McGill University, 3600 rue University, Montréal, QC H3A 2T8, Canada
6
McGill Space Institute, McGill University, 3550 rue University, Montréal, QC H3A 2A7, Canada
7
Joint ALMA Observatory, Alonso de Cordova 3107, Vitacura, Chile
8
Leiden Observatory, Niels Bohrweg 2, 2333 CA Leiden, The Netherlands
9
LPC2E – Université d’Orléans / CNRS, 45071 Orléans Cedex 2, France
10
Station de Radioastronomie de Nançay, Observatoire de Paris, PSL Research University, CNRS, Univ. Orléans, OSUC, 18330 Nançay, France
11
Oxford Astrophysics, Denys Wilkinson Building, Keble Road, Oxford OX1 3RH, UK
12
Department of Physics & Astronomy, University of the Western Cape, Private Bag X17, Bellville 7535, South Africa
13
Department of Physics and Electronics, Rhodes University, PO Box 94, Grahamstown 6140, South Africa
14
Max-Planck-Institut für Radioastronomie, Auf dem Hügel 69, 53121 Bonn, Germany
15
CSIRO Astronomy and Space Science, PO Box 1130, Bentley, WA 6102, Australia
Received:
3
April
2019
Accepted:
7
May
2019
We present an overview of the LOFAR Tied-Array All-Sky Survey (LOTAAS) for radio pulsars and fast transients. The survey uses the high-band antennas of the LOFAR Superterp, the dense inner part of the LOFAR core, to survey the northern sky (δ > 0°) at a central observing frequency of 135 MHz. A total of 219 tied-array beams (coherent summation of station signals, covering 12 square degrees), as well as three incoherent beams (covering 67 square degrees) are formed in each survey pointing. For each of the 222 beams, total intensity is recorded at 491.52 μs time resolution. Each observation integrates for 1 hr and covers 2592 channels from 119 to 151 MHz. This instrumental setup allows LOTAAS to reach a detection threshold of 1–5 mJy for periodic emission. Thus far, the LOTAAS survey has resulted in the discovery of 73 radio pulsars. Among these are two mildly recycled binary millisecond pulsars (P = 13 and 33 ms), as well as the slowest-spinning radio pulsar currently known (P = 23.5 s). The survey has thus far detected 311 known pulsars, with spin periods ranging from 4 ms to 5.0 s and dispersion measures from 3.0 to 217 pc cm−3. Known pulsars are detected at flux densities consistent with literature values. We find that the LOTAAS pulsar discoveries have, on average, longer spin periods than the known pulsar population. This may reflect different selection biases between LOTAAS and previous surveys, though it is also possible that slower-spinning pulsars preferentially have steeper radio spectra. LOTAAS is the deepest all-sky pulsar survey using a digital aperture array; we discuss some of the lessons learned that can inform the approach for similar surveys using future radio telescopes such as the Square Kilometre Array.
Key words: pulsars: general / methods: data analysis / methods: observational
© ESO 2019
1. Introduction
To date, there are over 2200 slow rotation-powered radio pulsars (Pspin ≳ 0.1 s; Bsurf ∼ 1012 G) and about 360 rotation-powered radio millisecond pulsars (MSPs; Pspin ≲ 30 ms; Bsurf ∼ 108 G) known (see ATNF catalogue1; Manchester et al. 2005). However, these represent only a small fraction (≲10%) of the total expected Galactic population (e.g. Keane et al. 2015, and references therein), and there remains a strong scientific drive to find more pulsars.
Radio pulsar searches are motivated by understanding the total Galactic population of neutron stars: for example, the various classes of neutron stars (Tauris et al. 2015), their spatial distribution (Lorimer 2011), evolution (Johnston & Karastergiou 2017), and birth rates (Faucher-Giguère & Kaspi 2006). Population synthesis models are based on the yields of previous pulsar surveys, and a variety of targeted, wide-field, low and high-frequency surveys are needed to constrain these models, while also averaging out the observational biases inherent to different survey approaches (e.g. Lorimer et al. 2006; Swiggum et al. 2014).
Furthermore, the discovery of individual pulsar systems has continued to provide important new insights into gravitational theories (e.g. Antoniadis et al. 2013; Archibald et al. 2018), the dense matter equation of state (e.g. Demorest et al. 2010), exotic stellar evolution (Ransom et al. 2014), accretion physics (e.g. Archibald et al. 2009) and the interstellar medium (Stinebring et al. 2001). A massive international effort is also underway with the goal of using a set of MSPs to directly detect gravitational waves (Detweiler 1979; Hobbs et al. 2010; Verbiest et al. 2016). Pulsar discoveries thus also have a wide-reaching and significant impact outside the field of pulsar astrophysics itself; in essence, they are nature’s clocks and can be used in many applications: for example, a pulsar based-timescale (Hobbs et al. 2012) and space navigation (Ray et al. 2017).
Pulsar radio spectra are typically characterised as a power-law, where the flux density at a particular frequency, Sν, is proportional to the observing frequency ν to some power, i.e. Sν ∝ να. This is not always a good characterization of the spectrum (Lewandowski et al. 2015; Jankowski et al. 2018), however, and a low-frequency turnover around 100–200 MHz appears to be present for some sources (Bilous et al. 2016, and references therein). Recently, Bates et al. (2013) found that the average spectral index is α = −1.4, with a 1σ dispersion of ∼12. Indeed, pulsars have been observed with a wide range of spectral indices, −4 ≲ α ≲ 0. This variation in spectral index is not well understood. In principle, it could be intrinsic, a function of viewing geometry, and/or related to the interstellar medium (Lewandowski et al. 2015; Rajwade et al. 2016). In general, however, pulsars are steep-spectrum radio sources, meaning that they become significantly brighter towards lower radio frequencies.
While the steep radio spectra of pulsars may at first seem to suggest that low radio frequencies (here defined as ν ≲ 400 MHz) are the best option for searches, there are a number of chromatic effects that create challenges for low-frequency pulsar surveys. Propagation through the ionised and magnetised interstellar medium (ISM) influences the observed pulsar signal via (i) scintillation, a frequency and time-dependent modulation/variability of the signal strength (Rickett 1970); (ii) scattering, multi-path propagation (Rickett 1977); (iii) dispersion, a frequency-dependent light-travel time through the intervening medium (e.g. Hassall et al. 2012, and references therein); and (iv) Faraday rotation, a rotation of the angle of linearly polarised emission (e.g. Manchester 1972; Brentjens & de Bruyn 2005; Sobey et al. 2019). A review of these propagation effects can be found in Rickett (1990). Finally, the synchrotron sky background temperature, Tsky, which increases rapidly towards lower radio observing frequencies: Tsky ∝ ν−2.55 (Haslam et al. 1981, 1982; Lawson et al. 1987), further reduces sensitivity at low Galactic latitudes.
Most relevant to low-frequency pulsar searches are dispersion and scattering. Dispersion introduces a time delay Δt ∝ DM ν−2 (where DM is the dispersion measure, the integrated column density of free electrons along the line-of-sight). This effect can be compensated for using incoherent dedispersion, but requires high frequency resolution. However, at low observing frequencies, dispersion within a frequency channel strongly limits the effective time resolution that can be achieved, especially for relatively high DM (> − pc cm−3). Therefore, searching for fast-spinning millisecond pulsars at the lowest radio frequencies requires coherent dedispersion (Bassa et al. 2017a,b).
Scattering causes a pulse broadening τscat ∝ ν−4.4 (under the assumption of a Kolmogorov turbulence spectrum; the exact frequency scaling can deviate from ν−4.4) that cannot be corrected for in pulsar surveys (in practice). The magnitude of scattering depends on the distribution of the material along the line-of-sight, and is loosely correlated with DM (Bhat et al. 2004; Geyer et al. 2017). Scattering becomes a significant limitation for low-frequency pulsar searches for DM > 50−100 pc cm−3. DM is a proxy for distance, given a model for the free electron distribution in the Galaxy (Cordes & Lazio 2002; Yao et al. 2017). Because of dispersive smearing and scattering, low-frequency searches are limited to detecting pulsars with DM ≲ 100 pc cm−3. This is not a major limitation for the search volume at high Galactic latitudes, but it precludes finding pulsars at large distances (≳3 kpc) within the Galactic plane.
Despite these challenges, pulsars were originally discovered at 81.5 MHz (Hewish et al. 1968), and low-frequency searches continue to be fruitful. In the last decade, low-frequency pulsar surveys have discovered ∼300 pulsars, and have mapped the nearby population both towards the Galactic plane and at higher Galactic latitudes. A 350-MHz survey of the northern Galactic plane with the Green Bank Telescope (GBT) discovered 33 pulsars (Hessels et al. 2008). Using a very similar observing strategy, the GBT Driftscan survey found 31 pulsars (Boyles et al. 2013; Lynch et al. 2013), including the pulsar stellar triple system PSR J0337+1715 (Ransom et al. 2014) and the transitional millisecond pulsar PSR J1023+0038 (Archibald et al. 2009). An ongoing, full-sky 350-MHz survey with the GBT, the GBNCC, has found 160 pulsars to date (Stovall et al. 2014; Kawash et al. 2018; Lynch et al. 2018). An ongoing driftscan survey with Arecibo at 327 MHz has found 82 pulsars3 (AO327; Deneva et al. 2013), while the GMRT High Resolution Southern Sky (GHRSS; Bhattacharyya et al. 2016) survey discovered 10 pulsars at 322 MHz in the Southern sky (−54° < δ < −40°). Targeted low-frequency searches of unidentified Fermi gamma-ray sources have also discovered 62 millisecond pulsars (e.g. Hessels et al. 2011; Ray et al. 2012; Cromartie et al. 2016; Bassa et al. 2017b, 2018; Pleunis et al. 2017).
In Coenen et al. (2014) we presented a pilot survey for pulsars and fast transients using the Low-Frequency Array (LOFAR; van Haarlem et al. 2013) and its high-time-resolution “beam-formed” modes (Stappers et al. 2011). We have subsequently built on those observations and started the LOFAR Tied-Array All-Sky Survey (LOTAAS). Compared with other modern, wide-field pulsar surveys, LOTAAS is novel because of its very low observing frequency (119−151 MHz) and long dwell time per pointing (1 h). These characteristics were instrumental in enabling the LOTAAS discovery of 7 rotating radio transients (Michilli et al. 2018) and a 23.5-s pulsar, which is by far the slowest-spinning radio pulsar known (Tan et al. 2018a).
More broadly, the discoveries of the rotating radio transients (RRATs; McLaughlin et al. 2006), radio-emitting magnetars (Camilo et al. 2006), intermittent pulsars (Kramer et al. 2006), and the fast radio bursts (FRBs; Lorimer et al. 2007; Thornton et al. 2013; Spitler et al. 2014) have shown that radio-emitting neutron stars have a host of emission properties and can sometimes be very sporadic in their detectability. These insights strongly motivate pulsar and fast transient surveys that achieve a large “on-sky” time, Σ = NobsΩtobs, here defined as the product of the total number of survey observations, Nobs, field-of-view per pointing, Ω, and dwell time per pointing, tobs. This makes LOTAAS complementary to other ongoing, low-frequency surveys, like the GBNCC and AO327 drift (Stovall et al. 2014; Deneva et al. 2013), which have higher instantaneous sensitivity but ∼30−60× lower dwell time and instantaneous field-of-view: ΣLOTAAS ≃ 23400 h deg2 at 135 MHz, ΣGBNCC ≃ 1430 h deg2 at 350 MHz above δ > −40°, and ΣAO327 ≃ 132 h deg2 at 327 MHz.
Here we present an overview of the LOTAAS survey and its first discoveries. In Sect. 2 we describe the novel observational setup of the survey, along with parameters such as time/frequency resolution and sensitivity. In Sects. 3 and 4 we describe the search pipeline and the results of the processing to date – in terms of pulsar discoveries and redetections. These results are discussed in Sect. 5. Lastly, we conclude in Sect. 6.
2. Survey description
2.1. Array configuration and beamforming
The LOFAR Tied-Array All-Sky Survey (LOTAAS) is an ongoing survey of the Northern sky for pulsars and transients with LOFAR. The survey uses the high-band antennas (HBAs) on the Superterp, the dense central part of the LOFAR core, since these provide the highest filling factor of LOFAR stations in the array and hence the best balance of field-of-view and raw sensitivity (van Haarlem et al. 2013; Stappers et al. 2011). This compact configuration also removes the need to compensate for differential ionospheric phase delays between stations. The HBAs on the Superterp are spread over 6 stations (CS002-007; van Haarlem et al. 2013), each of which has two sub-stations of 24 HBA tiles. Each HBA tile consists of 16 dual-polarisation antenna elements (dipoles) arranged in a 4 × 4 pattern. Hence, the total number of dual-polarisation dipoles on the Superterp is 4608.
LOTAAS uses LOFAR’s three stages of beamforming to create tied-array beams for the HBA antennas (van Haarlem et al. 2013; Stappers et al. 2011). First, the analogue beamformer of each HBA tile forms a tile beam out of the signals from the 16 antenna elements within a tile. After digitization and coarse channelization of the signals, these tile-beams are digitally beamformed into station beams. The final stage of beamforming is performed by the central LOFAR correlator and beamformer, which combines the signals of 12 HBA sub-stations into tied-array beams (see Stappers et al. 2011 for details). At the beginning of the LOTAAS survey in December 2012 a CPU-based IBM Blue Gene/P was used as the central LOFAR correlator and beamformer (Mol & Romein 2011). In May 2014 its functionality was transferred to COBALT, a GPU-based correlator and beamformer (Broekema et al. 2018).
For the LOTAAS band of 119 MHz–151 MHz (see Sect. 2.3), the Superterp HBA station beams vary in full-width at half maximum (FWHM) at zenith from 6 1 at 119 MHz to 4
 7 at 151 MHz. Tied-array beams from the 12 HBA sub-stations of the Superterp yield beams for which the FWHM varies with frequency between 0
 41 (119 MHz) to 0
 32 (151 MHz) at the zenith. Both the station and tied-array beams will become elongated in zenith angle when pointing away from the zenith, as the baselines between tiles in a station and the baselines between stations foreshorten.
2.2. Beam setup and tessellation
To maximise the number of tied-array beams as well as their sensitivity within station beams (sensitivity is higher towards the centre), LOTAAS forms three station beams (hereafter called sub-array pointings, or SAPs), each of which is tessellated by 61 tied-array beams (TABs). The TABs fill the central region of each SAP with a central TAB surrounded by four hexagonally filled TAB rings. The TAB rings are spaced at  (
( ) separation, where the FWHM of one TAB overlaps for 28% and 14% with adjacent TABs at 119 MHz and 151 MHz, respectively. This overlap provides pseudo-Nyquist sampling of the sky. The same is true for the SAPs, which are separated by
  at the vertices of an equilateral triangle. Figure 1 shows the layout of the SAPs and TABs.
 |
Fig. 1. Beam setup of a LOTAAS pointing. Panel a: LOTAAS pointing consists of three sub-array pointings (SAPs) separated by |


Furthermore, an additional 12 TABs are formed within each SAP. These are pointed towards known pulsars that happen to coincide with the SAP field-of-view, or at predetermined positions in the absence of known sources. Finally, the signals from the 12 HBA sub-stations per SAP are summed incoherently (Stappers et al. 2011; Broekema et al. 2018) to form an incoherent beam with a field-of-view equivalent to that of the station beam. Hence, a total of 222 beams are formed for each LOTAAS pointing. At zenith, the hexagonally tiled TABs of the three SAPs of a single pointing cover approximately 12 square degrees, while the incoherent beams cover 67 square degrees.
The setup of the tied-array and incoherent LOTAAS beams allows pointings to be efficiently tessellated to cover the entire sky. To fill in the gaps between the tied-array beams, three interleaved pointings are required to fully sample the sky, as depicted in Figs. 1 and 2. The large field-of-view of the incoherent beams has the advantage that the three pointings can be performed in three sequential passes, such that for each pass the incoherent beams completely cover the sky. As a result, each sky position is observed once with a coherently summed TAB and three times with an incoherently summed station beam. A total of 1953 individual pointings, 651 per pass, are required to cover the sky above a declination of δ > 0°. At the time of writing, January 2019, all pointings of Pass A and B have been obtained, and 43 pointings remain to be observed for Pass C. Initial processing of Pass A and B has been completed using a “Version 1.0” search pipeline, and the analysis of the pass C pointings is ongoing.
 |
Fig. 2. Stereographic projections of the Northern hemisphere in equatorial coordinates (δ > −3°). Lines of equal right ascension and declination are indicated with dashed gray lines (2h steps in RA and 15° in Dec, from 0° to 75°). The Galactic plane is shown as the black curve. Left: observed LOTAAS pointings as of January 2019, following the LOTAAS tessellation scheme. The sky coverage of the incoherent beams is shown for the three passes with different colours. Note that beamsizes have been scaled down for readability of the plot. Right: sky location of the first 73 LOTAAS pulsar discoveries. The period P and dispersion measure DM of the pulsars are indicated with different symbols and colours. Contours show the sky temperature Tsky at 135 MHz, as extrapolated from the Haslam et al. (1982) 408 MHz map, as well as the maximum predicted DM within our Galaxy by the Cordes & Lazio (2002) NE2001 model. |
2.3. Bandwidth and sampling
LOFAR stations are capable of digitizing dual-polarisation signals at 8-bit resolution for up to 488 sub-bands. Station beams can be formed for individual or groups of sub-bands. By choosing three station beams, LOTAAS can record data at a maximum of 162 sub-bands for each station beam. To optimise the LOTAAS sensitivity and TAB field-of-view we use the bottom part of the HBA band where LOFAR is most sensitive (van Haarlem et al. 2013). The 162 sub-bands of 195.3125 kHz bandwidth are centred at 135.25 MHz with a total bandwidth of 31.64 MHz. The central LOFAR correlator and beamformer uses a polyphase filter to channelise each sub-band to 16 channels, providing a total of 2592 channels over the LOTAAS band. The signals from the two linear polarisations are summed in quadrature to form total intensity (Stokes I). To comply with the network limitations between the correlator/beamformer and the central processing cluster, the data are decimated by a factor of 6 in time, to a time resolution of 491.52 μs. Finally, time/frequency samples, represented by 32-bit floating point values, are streamed to the central processing cluster at a data rate of 37.46 Gb s−1.
The large instantaneous field-of-view of a single LOTAAS pointing allows for long dwell times. Each LOTAAS pointing has a 1-h integration time, compared to the few-minute integration times used by other ongoing wide-field surveys. The long integration times increase the probability of discovering RRATs, intermittent pulsars and transient signals. With 1 h integration times, the data volume of a single LOTAAS pointing is 16.9 TB (with 32-bit samples).
2.4. Survey sensitivity
Following Dewey et al. (1985), the sensitivity of the LOTAAS survey for a pulsar with period P and effective pulse width Weff down to a minimum signal-to-noise S/Nmin, relates to the gain G and system temperature Tsys of the telescope, and the integration time tobs, bandwidth Δν and number of summed polarisations np of the observation through

The gain G depends on the effective area Aeff of the telescope ( , with kB the Boltzmann constant). For LOFAR, the number of stations and active dipoles defines the effective area, as well as the coherency of the tied-array beamforming. Following van Haarlem et al. (2013), the effective area for a HBA sub-station of 16 dipoles per tile and 24 tiles per sub-station at the central LOTAAS frequency of 135 MHz (λ = 2.2 m) is Aeff = 600 m2. Kondratiev et al. (2016) finds that the coherent summation of N stations scales as N0.85, and typically, 5% of dipoles are not in operation. Hence, the effective area of the LOFAR Superterp is (1−0.05)120.85600 m2 = 4712 m2. This yields a gain of G = 1.7 K Jy−1 at zenith.
The system temperature Tsys is the sum of the sky temperature Tsky and the receiver or antenna temperature Tant. The latter varies over the LOTAAS observing band, with a minimum value of 330 K at 125 MHz to 390 K at 151 MHz; we use the mean Tant of 360 K (Kondratiev et al. 2016). At the observing frequencies of LOTAAS, the system temperature Tsys can be dominated by the sky temperature Tsky. We use the reference sky temperature map at 408 MHz from Haslam et al. (1982), and the λ2.55 scaling law by Lawson et al. (1987) to estimate the sky temperature at 135 MHz. The all-sky averaged sky temperature at 135 MHz is Tsky = 510 K, but can be as low as 200 K at high Galactic latitudes to ≳1000 K in regions at low Galactic latitude towards the Galactic centre (see Fig. 2). For determining the sensitivity limits we use the best-case system temperature of Tsys = Tant + Tsky = 560 K, as well as the all-sky averaged value of Tsys = 870 K.
The intrinsic pulse width is broadened by effects due to the propagation of the pulse through the interstellar medium, depending on the way these are corrected for in the analysis. As defined in Lorimer & Kramer (2012), the total temporal smearing τtot is the quadratic sum of the finite sampling time τsamp, the dispersive smearing within a single channel τchan, the dispersive smearing across the full bandwidth due to the finite steps in trial DM τBW, and the dispersive smearing due to the piece-wise linear approximation of the quadratic dispersion law in the sub-band dedispersion algorithm (Manchester et al. 1996) τsub.
The top panel of Fig. 3 shows the dispersive smearing as a function of DM. Using the dedispersion plan described in Sect. 3.2, the dispersive smearing at low DM in LOTAAS is 0.9 ms, but rises to 20 ms at the highest-searched DM of 550 pc cm−3. Besides dispersive smearing, the pulsar pulses will also be smeared due to scattering in the interstellar medium. Whereas the effects of dispersion can largely be mitigated by dedispersion, scattering can not be corrected for in a blind search. Figure 3 also shows the smearing due to scattering as a function of DM, as predicted by the empirical relation from Bhat et al. (2004). Observationally, the smearing due to scattering for pulsars at the same DM but different location shows variations up to 2 or 3 orders of magnitude, and hence we plot a range of possible scattering variations. Based on this range, we expect smearing due to interstellar scattering to become dominant over dispersive smearing for DMs in the range of 20−100 pc cm−3.
 |
Fig. 3. Top: pulse broadening due to the finite sampling time, dispersive smearing due to the incoherent dedispersion algorithm used, and the effects of scattering using the scattering relation of Bhat et al. (2004). The diagonal dashed lines denote a one order-of-magnitude larger or smaller range in predicted scattering. Bottom: minimum detectable flux density for the LOTAAS survey as a function of DM. Sensitivity limits are plotted for different pulse periods P, and different system temperatures Tsys. The effect of pulse broadening due to interstellar scattering is shown by the dotted lines. |
The sensitivity limit of the LOTAAS survey is shown in the bottom panel of Fig. 3 as a function of dispersion measure for different pulse periods P and system temperature Tsys in the presence (or absence) of interstellar scattering. All these curves assume an intrinsic pulse width that is 3% of the pulse period, and a minimum detection significance of S/Nmin = 10. These curves indicate that LOTAAS has a best sensitivity of about 1.2 mJy for nearby slow pulsars at high Galactic latitude (DM < 50 pc cm−3, P > 0.1 s and Tsys = 560 K). Sensitivity to millisecond pulsars with P < 0.01 s is limited by the coarse sampling of 491.52 μs, though theoretically they could be detected if they are at low DM and relatively bright. In the presence of interstellar scattering following the Bhat et al. (2004) predictions, LOTAAS would not be able to detect pulsars with DMs above 200 pc cm−3, regardless of their spin period.
2.5. Confirmation and follow-up observations
The different observing modes and station locations of LOFAR allow for flexibility when confirming pulsar candidates and performing follow-up observations. For confirming pulsar candidates, LOTAAS uses the HBA dipoles of the 24 LOFAR core stations with 15-min exposures, yielding a factor of approximately 2 increase in sensitivity over the 6 stations of the Superterp using 1-h observations. The maximum baseline between core stations is 3.5 km, compared to 300 m for the stations on the Superterp, and hence the TABs using the core stations have a FWHM of  , a factor 7 smaller than Superterp TABs. To tile out the Superterp discovery beam, we form a single sub-array pointing and use 127 TABs in a hexagonal pattern. Depending on the accuracy of the discovery localization, the spacing between the TABs in confirmation observations can be decreased from Nyquist sampling to improve the localization by comparing the pulsar profile signal-to-noise between different beams. This approach allows the pulsar to be localised to an accuracy of about 3′. Examples of the tied-array beam tiling in confirmation and localization observations are shown in Fig. 4.
 |
Fig. 4. Tied-array beam (TAB) locations for confirmation observations (top) and localization observations (bottom). In these observations a single sub-array pointing is tiled with 127 TABs, where the colour indicates the cumulative signal-to-noise of the pulse profile in each beam. Note the change of scale between the two plots, denoted by the approximate TAB beamsize depicted in the lower left of each panel. In the localization observations the TABs overlap significantly to obtain a signal-to-noise weighted localization of the pulsar. |
Besides the larger number of stations and shorter integration time, confirmation observations use the same observational setup as the search observations. Hence, 162 sub-bands cover 31.64 MHz of bandwidth over the same frequency range, channelised to 2592 channels, with polarisations summed to form Stokes I and downsampled to a sampling time of 491.52 μs.
Once a newly discovered pulsar is confirmed and localised, the timing programme is started. The follow-up timing observations again use all the HBA dipoles of the 24 LOFAR core stations, but now only a single tied-array beam is formed. For this tied-array beam, dual-polarisation complex voltages, sampled at the 5.12 μs Nyquist rate of a 195.3125 kHz sub-band are recorded for 400 sub-bands. Hence, 78.125 MHz of bandwidth is recorded between frequencies of 110 MHz to 188 MHz. The complex voltages allow phase-coherent dedispersion removal with DSPSR (van Straten & Bailes 2011). Subsequent timing analysis is performed with PSRCHIVE (Hotan et al. 2004) and TEMPO2 (Hobbs et al. 2006; Edwards et al. 2006).
To constrain their radio spectra, newly discovered pulsars are also observed using the 76-m Lovell telescope at Jodrell Bank at 1532 MHz and occasionally at 330 MHz. For these observations the ROACH backend (Bassa et al. 2016) is used, providing 400 MHz of bandwidth centred at 1532 MHz and 64 MHz of bandwidth at 330 MHz. Pulsars that are visible at 1532 MHz are observed as part of the regular pulsar timing programme of the Lovell telescope. For some pulsars, follow-up observations at 1.4 GHz were also obtained with the Nançay Radio Telescope (Guillemot et al. 2016; Cognard et al. 2017).
3. Analysis
In terms of data volume, the LOTAAS survey is the largest pulsar survey performed to date, as the 1953 LOTAAS pointings produce 8 PB of raw 8-bit archived data. The management and the processing of such a huge amount of data is not a trivial task, and can pose a challenge for even the largest high performance computing (HPC) facilities available worldwide. For this reason, although at the beginning of the survey the HPC cluster of the Jodrell Bank pulsar group was used (HYDRUS; 552 CPU cores, 728 GB RAM), the main workhorse of the survey’s processing since 2014 has been the Dutch National Supercomputer Cartesius4 (over 44500 CPU cores, 115 TB RAM), managed by SURFSara5. The storage of the raw data and the processed results uses the SARA Long Term Archive (LTA), where a significant fraction of the LOFAR LTA is also hosted. The co-locality of the SARA LTA and Cartesius provides increased efficiency, required for various reprocessing runs of the stored data, with transfer speeds over 1 GB s−1.
The processing time required to reduce that amount of raw data is also immense. For the first processing runs, 10M CPU-hours were requested in 2013 in order to streamline the LOTAAS pipeline and get first results. This was followed by two 25M CPU-hours requests, in 2015 and 2017 respectively. These 60M CPU-hours have been granted by the Netherlands Organisation for Scientific Research (NWO) via proposal submission. Out of these 50M CPU-hours, 30M have been used to process all acquired data at the time of writing (January 2019), and reprocess the early LOTAAS data (acquired before May 2015), which had been processed only with the prototype LOTAAS pipeline.
The LOTAAS processing pipeline is based on the PRESTO6 (Ransom 2001) pulsar search software suite, with additional code written by members of the LOTAAS group for single-pulse searches (Michilli et al. 2018) and candidate classification (Lyon et al. 2016; Tan et al. 2018b). Currently it is a purely CPU-based pipeline; however, in the near future some parts will be replaced by GPU implementations. Here we present a detailed breakdown of the LOTAAS pipeline.
3.1. Pre-processing
The 16.9 TB of raw data for each 1-hr LOTAAS pointing are stored in HDF5 format7 on the central processing cluster. Here, the LOFAR Pulsar Pipeline (PuLP; Kondratiev et al. 2016) requantises the raw data from 32-bit floating point values to scaled and offset 8-bit integers, while also storing the scales and offsets. This step reduces the data volume by a factor of 4. The requantised output is stored in PSRFITS format (Hotan et al. 2004), yielding an 18 GB file for each of the 222 beams. The pipeline then identifies and creates radio frequency interference (RFI) masks, and performs a series of tests concerning the data quality (i.e. RFI statistics, packet loss in the correlator and beamformer). Finally, the pipeline folds the data for the TABs that contain known radio pulsars. The requantised PSRFITS files, RFI masks, and associated metadata are then ingested into the LTA. Observations for which the data quality tests fail are marked for re-observation at the end of the survey. Once the data have been validated to be on the LTA, they become available for downloading to Cartesius.
On the Cartesius supercomputer, the PSRFITS files are converted to SIGPROC filterbank format using an adapted version of PRESTO’s psrfits2fil.py. This version was tailored to LOTAAS data in order to control the desired block size (the minimum amount of data that can be processed in PRESTO), which was set to 512 spectral channels per sub-integration. This particular block size was selected in order to minimise the effects of dispersive smearing, which lowers the detection signal-to-noise for pulsars at higher DMs. Subsequently, new RFI masks are created using 2.5 s time integrations and the default settings of rfifind (for more details, see Cooper 2017). The size of these time segments was selected based on the typical RFI properties, in order to avoid excessive data masking. Typically, the fraction of data flagged as RFI is 10% for the TABs, and 15% for the incoherently summed station beams.
3.2. Dedispersion
The next step is the creation of the dedispersed time series for each beam. The DM range 0−546.5 pc cm−3 is searched; higher DMs are not searched because of the significant dispersion smearing and scattering at these low observing frequencies. At a frequency of 135 MHz, which is the centre frequency of the survey, the intra-channel dispersion smearing at a DM = 50 pc cm−3 is ∼2 ms, whereas for DM > 100 pc cm−3 scattering likely dominates (see Fig. 3). The dedispersion plan was created using the PRESTODDplan.py tool and consists of 10 120 DM-trials (Table 1). This dedispersion plan is aimed at minimizing the dispersive smearing over the selected DM range, while optimizing the processing efficiency when using parallelised dedispersion routines. The mpiprepsubband tool from PRESTO is used to create incoherently dedispersed time-series from the RFI masked filterbank files. This tool uses the sub-band dedispersion technique, which uses a piece-wise linear approximation to the quadratic dispersion law.
Dedispersion plan used by the LOTAAS survey.
3.3. Periodicity search
In order to look for periodic signals within the dedispersed time series, their power spectra are computed by applying a discrete fast Fourier transform (FFT) using the realfft tool. In order to improve our sensitivity to long-period pulsars, a red noise removal procedure is also applied to the power spectra using rednoise. The whitened power spectra are now searched for periodicities using accelsearch (Ransom et al. 2002), which detects the most significant periodic signals and uses harmonic summing to recover the power at multiples of the spin frequency. No acceleration searches are currently performed; accelsearch only searches at zero acceleration, due to the significant processing time that would otherwise be required. LOTAAS is thus not sensitive to pulsars in tight binary systems, unless these are fortuitously observed at a preferential, low-acceleration orbital phase. If a frequency has spectral significance in excess of 2σ, it is marked as a candidate and the corresponding harmonics up to the 16th are summed to increase the detection significance.
Once the list of candidates for all the DM-trials has been compiled, a sifting procedure to reduce the number of candidates by selecting only the most likely is performed. The sifting strategy in place is the one developed for the LOTAS pilot survey (Coenen et al. 2014) and is described in detail in Coenen (2013). Candidates with P < 2 ms or P > 15 s, along with candidates with DM < 0.5 pc cm−3 are rejected. We note that PSR J0250+5854, which has P = 23.5 s (Tan et al. 2018a), was discovered through its P < 15 s harmonics. Also rejected are those candidates that are not detected in neighbouring DM trials. Candidates with similar DMs and harmonically related periods are grouped, and only the instance with the highest signal-to-noise is kept. From the significantly reduced candidate list, only those with 5σ detections are folded.
3.4. Candidate folding
Folding is performed using the prepfold tool, which creates candidate files and diagnostic plots such as those shown in Fig. 5 for further inspection. In the folding analysis we use 100 pulse phase bins (50 for P < 50 ms), 288 sub-bands, 40 sub-integrations, and a running mean subtraction applied on the input filterbank file. The latter assisted in the discovery of PSR J0317+13, the observation of which was characterised by strong broadband and narrowband RFI, but had as a side effect the creation of artefacts during the folding: in other words, signal ‘dips’ around the profiles of bright sources with narrow profile widths, which changes the detection significance (see e.g. PSR J1635+23 in Fig. 5).
 |
Fig. 5. Examples of standard PRESTO diagnostic plots for periodic pulsar candidates. These plots are for LOTAAS discovered pulsars J1529+40, J1635+23 and the binary MSP J1658+36. |
3.5. Candidate classification
Each pointing generates approximately 20 000 candidates, and on completion the survey will have produced approximately 40 million candidates. Since visual inspection of all the candidates would be impossible, the machine learning classifiers described in Lyon et al. (2016) and Tan et al. (2018b) are used to reduce the candidate list to a reasonable number for visual inspection. These classifiers use the statistics (mean, variance, skewness and kurtosis) of the pulse profile and the DM curve (see Fig. 5; signal-to-noise as a function of DM). The Tan et al. (2018b) classifier expands on this approach by calculating the correlation coefficient between each sub-band and the profile, as well as the correlation coefficient between each sub-integration and the profile. The classifier uses the statistics of correlation coefficient distributions, in addition to the statistics of the profile and DM curve, to automatically classify periodicity candidates. This approach reduces the number of candidates per pointing to ∼220, i.e. one per beam on average.
3.6. Single-pulse search
A search for bright impulsive signals in the dedispersed time series is performed using single_pulse_search.py from PRESTO. The script convolves box-car functions of variable widths between 0.5−100 ms with the time series at different DMs. A value for the signal-to-noise is calculated for each bin of the convolved time series. If the signal-to-noise of one bin within a set of user specified time ranges is above a threshold of 5σ, the characteristics of the event are stored – i.e. arrival time with respect to the beginning of the time series, DM, width and signal-to-noise. Due to the large parameter space searched and the geographical area where the Superterp is located, a large number of events correspond to RFI. During a typical 1-h LOTAAS observation, ∼108 events are detected above a signal-to-noise ratio of 5. In order to lower the number of events generated by RFI, the L-SPS automated classifier has been developed (Michilli et al. 2018). It is a machine-learning-based classifier that uses the same Very Fast Decision Tree algorithm as the classifier for the periodicity search (Tan et al. 2018b). The classifier uses 5 scores based on the width and signal-to-noise of the signal as a function of DM. At the end of the classification, it produces detailed diagnostic plots to help quickly identify real signals. Typically, a few tens of diagnostic plots need to be visually inspected for each pointing.
4. Results
4.1. Discoveries
As of January 2019, the LOTAAS survey has discovered and confirmed 73 pulsars; in this overview paper, we present their properties. An up to date list of LOTAAS discoveries is maintained online8.
The pulse profiles of these 73 pulsars are shown in Fig. 6. The profiles are from the discovery observations, and hence representative of the data used to search for and find these pulsars. Throughout the paper, we refer to the LOTAAS discoveries by their discovery name, which is based on the right ascension and declination determined from the follow-up gridding observations. We report the pulsar name with two digits in declination. In the future, when timing solutions for these pulsars are presented, these names will be superseded by names based on their more precise timing positions.
 |
Fig. 6. Pulse profiles of the LOTAAS pulsar discoveries. Shown here are the discovery profiles using 100 pulse profile bins. The pulse profiles are rotated to place the peak at pulse phase ϕ = 0.25. The pulsar name, dispersion measure (in pc cm−3) and spin period (in seconds) are quoted for each pulsar. |
The properties of the LOTAAS discovered pulsars are listed in Table 2. The discovery spin period P, DM and the position (αJ2000, δJ2000) based on the best localization from the confirmation observations using the full LOFAR core. Here, we have assumed a positional uncertainty of 3′ in both αJ2000 and δJ2000, which should encompass possible systematic uncertainties of order 1′ due to ionospheric beam jitter, as well as the localization uncertainty due to gridding. Distance estimates based on the dispersion measure are computed using the NE2001 model for the Galactic electron distribution (Cordes & Lazio 2002).
LOTAAS pulsar discoveries and their properties.
Of these LOTAAS discoveries, 7 have been presented by Michilli et al. (2018), as these pulsars were discovered through their single-pulse emission using the L-SPS single pulse classifier presented in that paper. We briefly repeat their properties here. PSR J0139+33 is a RRAT that is not detectable in periodicity searches. PSRs J0302+22, J0317+13 and J1848+15 display strong pulse-to-pulse variability, and the first two were first discovered in the single pulse search, but are also detectable in periodicity searches. PSR J1848+15 and the remaining pulsars from Michilli et al. (2018), J0454+45, J1344+66 and J1404+11, were bright enough to be detected in both single pulse and periodicity searches. We note that Michilli et al. (2018) referred to PSRs J0302+20, J1344+66 and J1848+15 as J0301+20, J1340+65 and J1849+15, respectively. These pulsars and their aliases are listed in Table 2 and identified with the L-SPS comment.
PSR J0250+5854, the pulsar with the 23.5 s spin period, has been presented previously in Tan et al. (2018a). This spin period is a factor 2 longer than any previously known radio pulsar. Based on timing measurements over a 2.2-yr time span, and a position determined from LOFAR imaging, the spin period derivative was determined to be Ṗ = 2.7 × 10⁻¹⁴, placing this pulsar beyond the conventional pulsar deathline in the P−Ṗ diagram.
One of the LOTAAS discoveries, PSR J1404+11 matched in position and spin period with PSR J1404+12 discovered by Chandler (2003) in an Arecibo drift-scan survey at 430 MHz. However, Chandler (2003) reported DM = 25 pc cm−3, significantly offset from that found by LOTAAS, DM = 18.48 pc cm−3. This pulsar has since been independently confirmed by Tyul’bashev et al. (2018) and Brinkman et al. (2018), who confirm the 18.48 pc cm−3 dispersion measure. Another LOTAAS discovery, PSR J2053+17 matches the position, spin period and DM of an unconfirmed candidate found by Ray et al. (1996), also using Arecibo at 430 MHz. This rediscovery has since been independently confirmed by Brinkman et al. (2018).
During the preparation of this manuscript, some of the LOTAAS pulsars were presented as independent discoveries by Tyul’bashev et al. (2016, 2017) and Tyul’bashev et al. (2018) with the Puschino Telescope at 111 MHz. Tyul’bashev et al. (2016) presents seven new pulsars, of which four match the sky position and spin period of the LOTAAS discovered pulsars PSRs J0302+22, J0421+32, J0928+30 and J1722+35. Due to the small bandwidth (2.5 MHz) used by Tyul’bashev et al. (2016), their DMs are uncertain by several DM units, but consistent with the LOTAAS DMs. The same telescope is used by Tyul’bashev et al. (2017), who report 18 new pulsars, of which ten match the sky position, spin period, and DM of LOTAAS pulsars (PSRs J0121+14, J0811+37, J0935+33, J1529+40, J1635+23, J1638+40, J1657+33, J1953+30, J2051+12 and J2350+31). Again using the same telescope and instrumentation, 25 RRAT candidates, discovered through their single pulses, were published by Tyul’bashev et al. (2018). Although the Puschino sky positions and DMs have considerable uncertainties, it appears Tyul’bashev et al. (2018) detect single pulses from PSRs J0139+33, J0317+13, J1404+11, J1740+27, J1848+15, J2051+12 and J2209+22 (note that J2051+12 is also presented by Tyul’bashev et al. 2017). Table 2 indicates these pulsars with P.
Among the pulsars discovered via LOTAAS are two millisecond pulsars, both in binary systems. PSR J1658+36 was first discovered through reclassification of the candidates from early survey data with the new classifier (Tan et al. 2018b). The pulsar has a spin period of 33.0 ms and a DM of 3.05 pc cm−3, suggesting that it is relatively nearby at predicted distances of 225−500 pc based on the Galactic electron density models (Cordes & Lazio 2002; Yao et al. 2017). It is found to be in a binary system with an orbital period of 3.0 d and a minimum companion mass of 0.87 M⊙ (assuming a neutron star mass of 1.4 M⊙). This, combined with the low eccentricity of the orbit suggest that the binary companion is most likely a carbon-oxygen white dwarf. PSR J0827+53 is the second binary MSP discovered in the LOTAAS survey. It has a spin period of 13.52 ms and a DM = 23.103 pc cm−3. Galactic models of the electron density predict distances of d = 0.90 kpc (Cordes & Lazio 2002) and 1.57 kpc (Yao et al. 2017), respectively. Pulse period measurements show that PSR J0827+53 is in a circular 5.90 d orbit around a companion with a minimum mass of 0.69 M⊙, again assuming a canonical pulsar mass of 1.4 M⊙. This suggests that PSR J0827+53 is also likely to have a carbon-oxygen white dwarf, making both PSR J0827+53 and J1658+36 intermediate-mass binary pulsars.
Timing observations of all LOTAAS discovered pulsars are ongoing. These will determine their spin period derivatives and precise sky positions, and in the case of the two binary systems, the binary parameters. These results will be presented in future publications.
4.2. Redetection of known pulsars
We have thus far detected 311 individual known pulsars in the LOTAAS observations. These redetections are listed in Table A.1. Some of the pulsars detected with LOTAAS were discovered recently by surveys centred at low observing frequencies. A total of 47 of our redetections were originally discovered by the Green Bank Northern Celestial Cap Survey (GBNCC; Stovall et al. 2014). A further 6 were discovered by the AO327 Survey (Deneva et al. 2013). Eleven pulsars that have recently been discovered by ongoing pulsar surveys and are not yet in the ATNF pulsar catalogue (Manchester et al. 2005) are listed in the table as well.
To determine the sensitivity of LOTAAS, we have compared the measured flux density of the detected pulsars with the expected flux density of the pulsars from literature values. The folded profiles are flux calibrated using the method detailed by Kondratiev et al. (2016). The calibrated flux densities of the redetections are provided in Table A.1.
The measured flux densities ( ) assume that the pulsars are located at the centre of the TAB in which they were detected. However, most of the detections are offset from the centres of the TABs (θTAB), which results in reduced sensitivity. The angular distance of a pulsar from the centre of the SAP (θSAP) in which the pulsar is detected also reduces the sensitivity. Here, we applied a correction factor (
 ) to the measured flux densities that takes into account these offsets in order to obtain more accurate pulsar flux densities. For this, we modeled the TAB and SAP beams as a sinc2(θ) function with full-width half-maximum at the central observing frequency of LOTAAS. The maximum correction factors were set to 3.33 and 5 for the TABs and SAPs, respectively. We did not consider the evolution of the beam size with observing frequency. The corrected flux densities
  of the detections are listed in Table A.1.
The expected flux densities ( ) of the pulsars detected at 135 MHz are calculated by extrapolating values from the pulsar catalogue (Manchester et al. 2005) using the mean flux densities at 150 MHz (S150) or 400 MHz (S400) if the other is unavailable and using the spectral indices in the catalogue or α = −1.4 (Bates et al. 2013) if not provided. The majority of the S150 flux densities in the catalogue are from Bilous et al. (2016), Kondratiev et al. (2016), Frail et al. (2016), and Bell et al. (2016), while spectral indices are taken from Lorimer et al. (1995), Kuzmin & Losovsky (2001), Joshi et al. (2009), Bilous et al. (2016), Bell et al. (2016), Frail et al. (2016), and Jankowski et al. (2018).
A comparison of the measured flux densities of the detected pulsars and the expected values is shown in Fig. 7. Using all the known pulsars that we redetected in the LOTAAS survey, and for which we can correct our flux density measurements as well as predict flux densities based on literature values, we find that the ratio between the measured and expected flux density  . We conclude that, given the assumptions involved, LOTAAS is redetecting known pulsars at roughly their expected flux densities, on average.
 |
Fig. 7. Measured flux densities ( |


The measured flux densities of redetections of known pulsars also validate the minimum expected sensitivity limit of 1.2 mJy, as the faintest redetections have 135 MHz flux densities around 2–3 mJy (see Fig. 7). When accurate timing positions are available for the LOTAAS discovered pulsars, it will be possible to perform the beam corrections and determine their flux densities more accurately. These will be presented in future publications.
5. Discussion
5.1. Discovery parameter space
The LOTAAS survey has, to date, discovered 73 radio pulsars. The spin periods of these pulsars range from 13.52 ms to 23.5 s, and their DMs from 3.05 pc cm−3 to 130.56 pc cm−3. Known pulsars are redetected in the LOTAAS survey with spin periods from 4.2 ms to 5.0 s and DMs from 3.0 pc cm−3 to 217.0 pc cm−3. In Fig. 8a we show the spin period and DM of the LOTAAS discoveries, as well as known pulsars redetected in LOTAAS observations, in comparison to our predicted sensitivity limits. These sensitivity limits are for the optimal case of sky locations with a low sky temperature (Tsky = 200 K) and a narrow pulse profile (3% of the spin period); for wider pulse profiles and higher sky temperatures the sensitivity limits will be higher. We find that the LOTAAS discoveries and redetections fall within the area demarcated by the expected sensitivity limits.
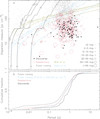 |
Fig. 8. Top: spin period and DM of pulsars that have been discovered (black dots) and redetected (red circles) in the LOTAAS survey. The size of the circles for the redetected pulsars denotes their flux density. Also plotted as thin grey points are known pulsars from the ATNF pulsar catalogue (excluding pulsars in globular clusters). The solid lines denote the sensitivity limits (in mJy) when taking into account smearing due to dispersion (black), as well as scattering, using the Bhat et al. (2004) (green) and Geyer et al. (2017) (blue) scattering relations. Bottom: cumulative spin period distributions for the pulsars discovered (black) and redetected (red) in the LOTAAS survey. These can be compared to the spin period distribution of pulsars from the ATNF catalogue (dark grey, again excluding pulsars in globular clusters), and when keeping pulsars with P > 0.02 s and DM < 200 pc cm−3 (light grey). The latter distribution can represent the distribution of pulsars that have been redetected in the LOTAAS survey. However, the LOTAAS discoveries tend to have longer spin periods, on average. |
Figure 8a also shows that the survey is limited by scattering; no new or known pulsars are detected above DM ≈ 220 pc cm−3. This observed limit is close to what one would expect from pulse profile broadening due to scattering. This is true when using either the Bhat et al. (2004) or Geyer et al. (2017) scattering versus DM relations.
5.2. Spin period distributions
Despite the coarse time resolution of the survey, LOTAAS has proven to be sensitive to recycled MSPs, as two of the discoveries are mildly recycled MSPs with periods of 13 ms and 33 ms, respectively. Among the redetections, 6 fully recycled MSPs (P < 10 ms) are detected. All of these are at low DM (DM ≲ 20 pc cm−3), high Galactic latitude (|b| ≳ 20°), and intrinsically bright ( or
or  ). This allows for their detection despite temporal smearing from dispersion and scattering.
The cumulative histograms of the spin period distribution of the pulsars discovered and redetected in the survey (Fig. 8b) show that they have longer spin periods, on average, compared with the currently known population. Among the LOTAAS discoveries is PSR J0250+5854, whose 23.5-s spin period is more than twice as long as the next slowest spinning radio pulsar known (Tan et al. 2018a). To a large extent, the slower spin periods of LOTAAS discoveries are due to the selection biases of the LOTAAS survey, i.e. reduced sensitivity to short period pulsars and pulsars at high DMs. Masking these selection biases by placing simple limits on period and DM, we find that we can reproduce the spin period distribution of the redetected known pulsars with that of all known pulsars with spin periods P > 20 ms and DM < 200 pc cm−3.
Since both the newly discovered pulsars as well as the redetected known pulsars will have the same selection biases, it is surprising that the discovered pulsars tend to have longer spin periods. A two-sided Kolmogorov–Smirnov test shows that there is only a 10% probability that both samples are drawn from the same parent distribution. The origin of this difference is unclear. The 1-hr integrations improve the sensitivity of LOTAAS to long period pulsars, compared with surveys using shorter integrations. Foremost, more pulses will be present in longer observations (Tan et al. 2018a), and longer observations also reduce the impact of pulse-to-pulse variation (Stovall et al. 2014). Furthermore, the low radio observing frequency of LOTAAS provides additional benefits in that low-DM pulsars can be more easily identified from zero-DM RFI due to the larger DM-induced sweeps. Similarly, at low radio observing frequencies any unmasked zero-DM RFI will be spread over more time samples of the dedispersed time-series, and hence the red noise in the power spectrum due to these variations will be at lower spin frequencies, further improving the sensitivity to long period pulsars. However, the presence of red noise in the power spectrum will lower the sensitivity to long period pulsars (van Heerden et al. 2017). Characterizing the impact of these effects as selection biases on the observed spin period distribution is non-trivial and will require injecting synthetic pulsar signals into the real data, e.g. as was done for PALFA by Lazarus et al. (2015). Measurements of the spin period derivatives and spectral indices of the LOTAAS discovered pulsar population may provide additional tests to determine whether this population has longer spin periods.
5.3. Maximum dispersion measures
The measured DMs of the LOTAAS discoveries allowed us to probe the approximate distribution of these pulsars in the Galaxy via distance estimates using the NE2001 (Cordes & Lazio 2002) and YMW16 (Yao et al. 2017) models for the Galactic electron density distribution. The distance estimates shown in Table 2 are from NE2001, and suggest that all LOTAAS discoveries are relatively nearby, with the furthest being at a distance of 6.18 kpc. On the other hand, for the lines-of-sight of 14 out of the 73 LOTAAS discoveries, the YMW16 model predicts maximum DM values that are smaller than the observed pulsar DMs, suggesting that these pulsars are extragalactic. We investigate this discrepancy in the following paragraphs.
As most of the LOTAAS discoveries are found at high Galactic latitudes, we first looked at the distribution of these pulsars in terms of their distances from the Galactic plane. Figure 9 shows the distance of each pulsar above or below the Galactic plane versus the distances to the pulsars from Earth along the plane based on the predictions made by the two electron density models. The colours of the circles denote the percentage of maximum DM value expected from free electrons in the Galaxy along the line-of-sight to the pulsar. The black triangles are pulsars with measured DMs that are greater than the maximum-expected DM from the Galaxy. We note that for the NE2001 model, most of the pulsars are predicted to be within 2 kpc of the Galactic plane, while the distribution of the distances of the pulsars away from the Galactic plane is more spread out according to the YMW16 model. While the distances predicted by the NE2001 model are more reasonable in our sample, the model is known to underestimate distances to pulsars at high Galactic latitudes (e.g. Lorimer et al. 2006; Chatterjee et al. 2009). Attempts have been made to revise the electron density models away from the Galactic plane (e.g. Gaensler et al. 2008; Savage & Wakker 2009; Schnitzeler 2012).
 |
Fig. 9. Distances of LOTAAS discoveries above/below the Galactic plane versus their distance along the Galactic plane, as predicted by the NE2001 (Cordes & Lazio 2002) and YMW16 (Yao et al. 2017) models for the Galactic free electron density distribution. The colour of each point denotes the DM of the pulsar compared to the maximum predicted DM along the particular line-of-sight. The pulsars for which the YMW16 model predicts maximum DMs less than the observed DMs are plotted with black triangles, where the distances to the pulsars are fixed at a limit of 4 kpc above or below the Galactic plane. |
The YMW16 model, however, seems to underestimate the electron density away from the Galactic plane. It is unclear if this effect is systematic or random. As the electron density models are fits to the mean electron density distribution, fluctuations in the real electron density distribution will lead to both over as well as under-estimated distances. We found that there is no specific direction where the pulsars are found to have distances overestimated by the YMW16 model. The discrepancy compared to the YMW16 model most likely originates from the thin and thick disc components used to model the electron density away from the Galactic plane, where the actual electron density is likely to be higher than the modelled value. For the 14 pulsars with DMs in excess of the maximum DM predicted by the YWM16 model, the mean excess is about 10%, suggesting that the electron density is at least 10% higher than predicted by the YMW16 model. The discrepancy impacts 14 out of 55 pulsars with |b| > 15°.
5.4. Candidate matching
In an all-sky survey such as LOTAAS, many candidates correspond to the redetection of known pulsars. These redetections are useful for testing the search pipeline, veryfing that the sensitivity of the survey is as expected, and are used in training the candidate classifiers. However, they can also be problematic. In the LOTAAS survey, PSR B0329+54, the brightest pulsar in the Northern sky, was detected at least 1400 times in 141 beams out of a possible 222 beams of a single pointing. These detections were of both its fundamental spin period, but also many harmonics of the spin period. As a result, bright known pulsars can make up a significant fraction of candidates generated in the survey, potentially limiting the ability to recognise new pulsars (Lyon et al. 2018).
Identifying that a candidate corresponds to a known pulsar can also be problematic. When a candidate pulsar is detected, the position, period and DM are used as key identifiers to associate it with a known pulsar in the pulsar catalogue and pulsar discovery lists (such as web pages related to ongoing surveys). Although the combination of these identifiers is normally enough to determine a match/non-match, they can sometimes be incorrect or misleading. For example, the optimised DM of a candidate may not match the DM in the pulsar catalogue for an associated source. This is particularly true for DM values that were obtained at high frequencies.
The discovery of PSR J2053+17 in the LOTAAS survey demonstrates the importance of accurate DM measurements of known pulsars. The candidate period and DM of PSR J2053+17 showed remarkable resemblance to that of the 1/6th harmonic of PSR B0329+54 with a period ratio of 5.99. PSR B0329+54 is located 81 5 away from the beam in which PSR J2053+17 was detected but, as discussed above, PSR B0329+54 is easily detected by LOFAR and sidelobe detections are common. Using the catalogue parameters alone, it was difficult to determine the difference between these sources. However, as PSR B0329+54 had been previously detected by LOTAAS it was possible to compare the LOFAR measurements of DM and determine that they were definitely different sources. The precise and accurate measurement of the DM of both pulsars was made possible within the LOTAAS survey because of its large bandwidth and low observing frequency. We compared the detected DM values of the known pulsars with the values from the ATNF pulsar catalogue (Manchester et al. 2005) before updates that used LOFAR derived DMs from Bilous et al. (2016), and found that 12 of the pulsars have a difference in DM value of more than 2 pc cm−3. Since then, five of the pulsars have been updated with the improved DM values.
Another example of the issues associated with candidate matching uncertainty is highlighted by the discovery of PSR J1740+27 (P = 1.0582 s, DM = 35.46 ± 0.04 pc cm−3). The spin period of this pulsar matched that of known pulsar PSR J1746+2540 to within a period ratio of 1.00002, and with an angular separation of just 2° between the discovery beam and position of the previously known pulsar. When considering the sidelobes of LOFAR, it was possible that these two sources were the same. The original discovery of PSR J1746+2540 by Foster et al. (1995) using Arecibo at 430 MHz reported DM = 50 ± 8 pc cm−3, which was improved to DM = 51.5 ± 0.2 pc cm−3 by Lewandowski et al. (2004) from follow-up timing observations. These relatively large DM uncertainties complicate the unambiguous identification of a candidate as a new pulsar. For comparison, the LOFAR census by Bilous et al. (2016) constrained the dispersion measure to DM = 51.2044 ± 0.0033 pc cm−3. A full sky campaign to determine accurate DM values of all currently known pulsars is required before surveys are conducted with telescopes like the Square Kilometre Array (SKA; Braun et al. 2015; Keane et al. 2015) in order to enable the necessary automatic filtering of known pulsars and facilitate the unambiguous identification of new pulsar candidates.
This process led us to question how likely it was for two pulsars to have the same period to such precision. This was answered by considering the well-known “birthday problem” using Stirling’s approximation for large factorials. We determined that only 380 pulsars are required for a 50% probability of two pulsars sharing the same period to 4 decimal places and 1000 pulsars for 99.9% probability. The number of known pulsars now exceeds 2500 so it is statistically certain that at least two pulsars will share the same period to this precision. As we move forward to the SKA this problem may become ever more acute.
6. Conclusions
The LOFAR Tied-Array All-Sky Survey (LOTAAS) is a 135-MHz pulsar and fast transient survey covering the entire Northern hemisphere. By using the LOFAR Superterp, the dense central part of the LOFAR core, in combination with the tied-array beamforming capabilities of LOFAR, LOTAAS is able to reach sensitivities of 1–5 mJy for a large instantaneous field of view, allowing for long integration times. This is the deepest survey to date for radio pulsars and fast transients at such low observing frequencies (< 200 MHz).
As of January 2019, over 90% of the survey observations have been obtained, and first-pass processing using the pulsar search pipeline described in Sect. 3 is progressing. LOTAAS has so far discovered 73 radio pulsars, whose basic parameters are presented here. Furthermore, a total of 311 previously known pulsars have been redetected in LOTAAS survey pointings. Despite the relatively coarse time resolution of 492 μs, LOTAAS is sensitive to mildly recycled MSPs, and has discovered two binary MSPs. Due to the long integration times of 1 hr, LOTAAS is particularly sensitive to long-spin period pulsars, which is demonstrated by the discovery of the 23.5-s spin period pulsar J0250+5854 (Tan et al. 2018a). The observed spin period distribution of LOTAAS pulsar discoveries is skewed towards longer spin periods in comparison to the known pulsar population. Selection biases may explain this difference, though we can not rule out that the LOTAAS-discovered pulsars have, on average, longer spin periods.
The observations of known pulsars redetected in the LOTAAS survey are used to assess the survey sensitivity and flux density scale. We find that, on average, LOTAAS is recovering known pulsars at the expected flux densities, and is reaching the expected sensitivity limit.
While the current periodicity pipeline has proven successful in discovering pulsars, the computational requirements to process the large data volume produced by LOTAAS has meant that currently only an un-accelerated FFT-based periodicity search has been performed. With computational capabilities ever increasing, and new algorithms being developed, we plan to reprocess the LOTAAS survey in several ways. First, we plan to use recent implementations of the fast folding algorithm (FFA; Staelin 1969; Kondratiev et al. 2009; Cameron et al. 2017; Parent et al. 2018) to further improve the sensitivity to long period pulsars. Secondly, GPU-accelerated algorithms to search for pulsars in binary systems, taking into account acceleration (e.g. Dimoudi et al. 2018), have become available, which may enable searching the LOTAAS survey for accelerated pulsars. Reprocessing the Parkes Multi-beam Survey (Manchester et al. 2001) has led to many new pulsar discoveries, long after the data was taken (e.g. Knispel et al. 2013; Eatough et al. 2013). Given that all LOTAAS data, after a 1 yr proprietary period, is publicly available in the LOFAR long-term archive, it may reveal many more pulsars in the future.
Catalogue version 1.59, http://www.atnf.csiro.au/people/pulsar/psrcat/
This is a somewhat shallower scaling compared to the α = −1.8 found by Maron et al. (2000).
Acknowledgments
This paper is based (in part) on data obtained with the International LOFAR Telescope (ILT) under project codes LC0_034, LC1_052, LT2_003, LC3_014, LC4_030, LT5_004, LC9_023 and LT10_005. LOFAR (van Haarlem et al. 2013) is the Low Frequency Array designed and constructed by ASTRON. It has observing, data processing, and data storage facilities in several countries, that are owned by various parties (each with their own funding sources), and that are collectively operated by the ILT foundation under a joint scientific policy. The ILT resources have benefitted from the following recent major funding sources: CNRS-INSU, Observatoire de Paris and Université d’Orléans, France; BMBF, MIWF-NRW, MPG, Germany; Science Foundation Ireland (SFI), Department of Business, Enterprise and Innovation (DBEI), Ireland; NWO, The Netherlands; The Science and Technology Facilities Council, UK. We thank the operators of LOFAR for performing the LOTAAS observations. This work was carried out on the Dutch national e-infrastructure with the support of the SURF Cooperative. We thank the SURFsara staff for their patience and expertise. The research was supported by a NWO Science subsidy for the use of the National Computer Facilities (project 16676). JWTH, CB, DM, SS and VIK acknowledge funding from an NWO Vidi fellowship and from the European Research Council (ERC) under the European Union’s Seventh Framework Programme (FP/2007–2013)/ERC Starting Grant agreement nr. 337062 (“DRAGNET”; PI: Hessels). BWS and SS acknowledge funding from the ERC under the European Union’s Horizon 2020 research and innovation programme (grant agreement nr. 694745). JvL acknowledges funding from the ERC under the European Union’s Seventh Framework Programme (FP/2007–2013)/ERC Grant Agreement nr. 617199 (“ALERT”), and from Vici research programme “ARGO” with project nr. 639.043.815, financed by NWO.
References
- Antoniadis, J., Freire, P. C. C., Wex, N., et al. 2013, Science, 340, 448 [Google Scholar]
- Archibald, A. M., Stairs, I. H., Ransom, S. M., et al. 2009, Science, 324, 1411 [NASA ADS] [CrossRef] [PubMed] [Google Scholar]
- Archibald, A. M., Gusinskaia, N. V., Hessels, J. W. T., et al. 2018, Nature, 559, 73 [NASA ADS] [CrossRef] [Google Scholar]
- Bassa, C. G., Janssen, G. H., Karuppusamy, R., et al. 2016, MNRAS, 456, 2196 [NASA ADS] [CrossRef] [Google Scholar]
- Bassa, C. G., Pleunis, Z., & Hessels, J. W. T. 2017a, Astron. Comput., 18, 40 [NASA ADS] [CrossRef] [Google Scholar]
- Bassa, C. G., Pleunis, Z., Hessels, J. W. T., et al. 2017b, ApJ, 846, L20 [NASA ADS] [CrossRef] [Google Scholar]
- Bassa, C. G., Pleunis, Z., Hessels, J. W. T., et al. 2018, in Pulsar Astrophysics the Next Fifty Years, eds. P. Weltevrede, B. B. P. Perera, L. L. Preston, & S. Sanidas, IAU Symp., 337, 33 [NASA ADS] [Google Scholar]
- Bates, S. D., Lorimer, D. R., & Verbiest, J. P. W. 2013, MNRAS, 431, 1352 [NASA ADS] [CrossRef] [Google Scholar]
- Bell, M. E., Murphy, T., Johnston, S., et al. 2016, MNRAS, 461, 908 [NASA ADS] [CrossRef] [Google Scholar]
- Bhat, N. D. R., Cordes, J. M., Camilo, F., Nice, D. J., & Lorimer, D. R. 2004, ApJ, 605, 759 [CrossRef] [Google Scholar]
- Bhattacharyya, B., Cooper, S., Malenta, M., et al. 2016, ApJ, 817, 130 [NASA ADS] [CrossRef] [Google Scholar]
- Bilous, A. V., Kondratiev, V. I., Kramer, M., et al. 2016, A&A, 591, A134 [NASA ADS] [CrossRef] [EDP Sciences] [Google Scholar]
- Boyles, J., Lynch, R. S., Ransom, S. M., et al. 2013, ApJ, 763, 80 [NASA ADS] [CrossRef] [Google Scholar]
- Braun, R., Bourke, T., Green, J. A., Keane, E., & Wagg, J. 2015, Advancing Astrophysics with the Square Kilometre Array (AASKA14), 174 [Google Scholar]
- Brentjens, M. A., & de Bruyn, A. G. 2005, A&A, 441, 1217 [NASA ADS] [CrossRef] [EDP Sciences] [Google Scholar]
- Brinkman, C., Freire, P. C. C., Rankin, J., & Stovall, K. 2018, MNRAS, 474, 2012 [NASA ADS] [CrossRef] [Google Scholar]
- Broekema, P. C., Mol, J. J. D., Nijboer, R., et al. 2018, Astron. Comput., 23, 180 [NASA ADS] [CrossRef] [Google Scholar]
- Cameron, A. D., Barr, E. D., Champion, D. J., Kramer, M., & Zhu, W. W. 2017, MNRAS, 468, 1994 [NASA ADS] [CrossRef] [Google Scholar]
- Camilo, F., Ransom, S. M., Halpern, J. P., et al. 2006, Nature, 442, 892 [NASA ADS] [CrossRef] [PubMed] [Google Scholar]
- Chandler, A. M. 2003, PhD Thesis, California Institute of Technology [Google Scholar]
- Chatterjee, S., Brisken, W. F., Vlemmings, W. H. T., et al. 2009, ApJ, 698, 250 [NASA ADS] [CrossRef] [Google Scholar]
- Coenen, T. 2013, PhD Thesis, The University of Amsterdam [Google Scholar]
- Coenen, T., van Leeuwen, J., Hessels, J. W. T., et al. 2014, A&A, 570, A60 [NASA ADS] [CrossRef] [EDP Sciences] [Google Scholar]
- Cognard, I., Freire, P. C. C., Guillemot, L., et al. 2017, ApJ, 844, 128 [NASA ADS] [CrossRef] [Google Scholar]
- Cooper, S. 2017, PhD Thesis, The University of Manchester [Google Scholar]
- Cordes, J. M., & Lazio, T. J. W. 2002, ArXiv e-prints [arXiv:astro-ph/0207156] [Google Scholar]
- Cromartie, H. T., Camilo, F., Kerr, M., et al. 2016, ApJ, 819, 34 [Google Scholar]
- Demorest, P. B., Pennucci, T., Ransom, S. M., Roberts, M. S. E., & Hessels, J. W. T. 2010, Nature, 467, 1081 [NASA ADS] [CrossRef] [PubMed] [Google Scholar]
- Deneva, J. S., Stovall, K., McLaughlin, M. A., et al. 2013, ApJ, 775, 51 [NASA ADS] [CrossRef] [Google Scholar]
- Detweiler, S. 1979, ApJ, 234, 1100 [NASA ADS] [CrossRef] [Google Scholar]
- Dewey, R. J., Taylor, J. H., Weisberg, J. M., & Stokes, G. H. 1985, ApJ, 294, L25 [NASA ADS] [CrossRef] [Google Scholar]
- Dimoudi, S., Adamek, K., Thiagaraj, P., et al. 2018, ApJS, 239, 28 [NASA ADS] [CrossRef] [Google Scholar]
- Eatough, R. P., Kramer, M., Lyne, A. G., & Keith, M. J. 2013, MNRAS, 431, 292 [NASA ADS] [CrossRef] [Google Scholar]
- Edwards, R. T., Hobbs, G. B., & Manchester, R. N. 2006, MNRAS, 372, 1549 [NASA ADS] [CrossRef] [Google Scholar]
- Faucher-Giguère, C.-A., & Kaspi, V. M. 2006, ApJ, 643, 332 [NASA ADS] [CrossRef] [Google Scholar]
- Foster, R. S., Cadwell, B. J., Wolszczan, A., & Anderson, S. B. 1995, ApJ, 454, 826 [NASA ADS] [CrossRef] [Google Scholar]
- Frail, D. A., Jagannathan, P., Mooley, K. P., & Intema, H. T. 2016, ApJ, 829, 119 [NASA ADS] [CrossRef] [Google Scholar]
- Gaensler, B. M., Madsen, G. J., Chatterjee, S., & Mao, S. A. 2008, PASA, 25, 184 [NASA ADS] [CrossRef] [Google Scholar]
- Geyer, M., Karastergiou, A., Kondratiev, V. I., et al. 2017, MNRAS, 470, 2659 [NASA ADS] [CrossRef] [Google Scholar]
- Guillemot, L., Smith, D. A., Laffon, H., et al. 2016, A&A, 587, A109 [NASA ADS] [CrossRef] [EDP Sciences] [Google Scholar]
- Haslam, C. G. T., Klein, U., Salter, C. J., et al. 1981, A&A, 100, 209 [NASA ADS] [Google Scholar]
- Haslam, C. G. T., Salter, C. J., Stoffel, H., & Wilson, W. E. 1982, A&AS, 47, 1 [NASA ADS] [Google Scholar]
- Hassall, T. E., Stappers, B. W., Hessels, J. W. T., et al. 2012, A&A, 543, A66 [NASA ADS] [CrossRef] [EDP Sciences] [Google Scholar]
- Hessels, J. W. T., Ransom, S. M., Kaspi, V. M., et al. 2008, in 40 Years of Pulsars: Millisecond Pulsars, Magnetars and More, eds. C. Bassa, Z. Wang, A. Cumming, & V. M. Kaspi, AIP Conf. Ser., 983 613 [NASA ADS] [CrossRef] [Google Scholar]
- Hessels, J. W. T., Roberts, M. S. E., McLaughlin, M. A., et al. 2011, in AIP Conf. Ser., eds. M. Burgay, N. D’Amico, P. Esposito, A. Pellizzoni, & A. Possenti, 1357, 40 [NASA ADS] [Google Scholar]
- Hewish, A., Bell, S. J., Pilkington, J. D. H., Scott, P. F., & Collins, R. A. 1968, Nature, 217, 709 [NASA ADS] [CrossRef] [Google Scholar]
- Hobbs, G. B., Edwards, R. T., & Manchester, R. N. 2006, MNRAS, 369, 655 [NASA ADS] [CrossRef] [Google Scholar]
- Hobbs, G., Archibald, A., Arzoumanian, Z., et al. 2010, Class. Quant. Grav., 27, 084013 [NASA ADS] [CrossRef] [Google Scholar]
- Hobbs, G., Coles, W., Manchester, R. N., et al. 2012, MNRAS, 427, 2780 [NASA ADS] [CrossRef] [Google Scholar]
- Hotan, A. W., van Straten, W., & Manchester, R. N. 2004, PASA, 21, 302 [NASA ADS] [CrossRef] [Google Scholar]
- Jankowski, F., van Straten, W., Keane, E. F., et al. 2018, MNRAS, 473, 4436 [NASA ADS] [CrossRef] [Google Scholar]
- Johnston, S., & Karastergiou, A. 2017, MNRAS, 467, 3493 [NASA ADS] [CrossRef] [Google Scholar]
- Joshi, B. C., McLaughlin, M. A., Lyne, A. G., et al. 2009, MNRAS, 398, 943 [NASA ADS] [CrossRef] [Google Scholar]
- Kawash, A. M., McLaughlin, M. A., Kaplan, D. L., et al. 2018, ApJ, 857, 131 [NASA ADS] [CrossRef] [Google Scholar]
- Keane, E., Bhattacharyya, B., Kramer, M., et al. 2015, Advancing Astrophysics with the Square Kilometre Array (AASKA14), 40 [CrossRef] [Google Scholar]
- Knispel, B., Eatough, R. P., Kim, H., et al. 2013, ApJ, 774, 93 [Google Scholar]
- Kondratiev, V. I., McLaughlin, M. A., Lorimer, D. R., et al. 2009, ApJ, 702, 692 [NASA ADS] [CrossRef] [Google Scholar]
- Kondratiev, V. I., Verbiest, J. P. W., Hessels, J. W. T., et al. 2016, A&A, 585, A128 [NASA ADS] [CrossRef] [EDP Sciences] [Google Scholar]
- Kramer, M., Lyne, A. G., O’Brien, J. T., Jordan, C. A., & Lorimer, D. R. 2006, Science, 312, 549 [NASA ADS] [CrossRef] [PubMed] [Google Scholar]
- Kuzmin, A. D., & Losovsky, B. Y. 2001, A&A, 368, 230 [NASA ADS] [CrossRef] [EDP Sciences] [Google Scholar]
- Lawson, K. D., Mayer, C. J., Osborne, J. L., & Parkinson, M. L. 1987, MNRAS, 225, 307 [NASA ADS] [CrossRef] [Google Scholar]
- Lazarus, P., Brazier, A., Hessels, J. W. T., et al. 2015, ApJ, 812, 81 [NASA ADS] [CrossRef] [Google Scholar]
- Lewandowski, W., Wolszczan, A., Feiler, G., Konacki, M., & Sołtysiński, T. 2004, ApJ, 600, 905 [NASA ADS] [CrossRef] [Google Scholar]
- Lewandowski, W., Rożko, K., Kijak, J., & Melikidze, G. I. 2015, ApJ, 808, 18 [NASA ADS] [CrossRef] [Google Scholar]
- Lorimer, D. R. 2011, in High-Energy Emission from Pulsars and their Systems, (Berlin, Heidelberg: Springer-Verlag) 21 [CrossRef] [Google Scholar]
- Lorimer, D. R., & Kramer, M. 2012, Handbook of Pulsar Astronomy (Cambridge: Cambridge University Press) [Google Scholar]
- Lorimer, D. R., Yates, J. A., Lyne, A. G., & Gould, D. M. 1995, MNRAS, 273, 411 [NASA ADS] [CrossRef] [Google Scholar]
- Lorimer, D. R., Faulkner, A. J., Lyne, A. G., et al. 2006, MNRAS, 372, 777 [NASA ADS] [CrossRef] [Google Scholar]
- Lorimer, D. R., Bailes, M., McLaughlin, M. A., Narkevic, D. J., & Crawford, F. 2007, Science, 318, 777 [NASA ADS] [CrossRef] [PubMed] [Google Scholar]
- Lynch, R. S., Boyles, J., Ransom, S. M., et al. 2013, ApJ, 763, 81 [NASA ADS] [CrossRef] [Google Scholar]
- Lynch, R. S., Swiggum, J. K., Kondratiev, V. I., et al. 2018, ApJ, 859, 93 [NASA ADS] [CrossRef] [Google Scholar]
- Lyon, R. J., Stappers, B. W., Cooper, S., Brooke, J. M., & Knowles, J. D. 2016, MNRAS, 459, 1104 [NASA ADS] [CrossRef] [Google Scholar]
- Lyon, R. J., Stappers, B. W., Levin, L., Mickaliger, M. B., & Scaife, A. 2018, Astron. Comput., submitted [arXiv:1810.06012] [Google Scholar]
- Manchester, R. N. 1972, ApJ, 172, 43 [NASA ADS] [CrossRef] [Google Scholar]
- Manchester, R. N., Lyne, A. G., D’Amico, N., et al. 1996, MNRAS, 279, 1235 [NASA ADS] [CrossRef] [Google Scholar]
- Manchester, R. N., Lyne, A. G., Camilo, F., et al. 2001, MNRAS, 328, 17 [NASA ADS] [CrossRef] [Google Scholar]
- Manchester, R. N., Hobbs, G. B., Teoh, A., & Hobbs, M. 2005, AJ, 129, 1993 [NASA ADS] [CrossRef] [Google Scholar]
- Maron, O., Kijak, J., Kramer, M., & Wielebinski, R. 2000, A&AS, 147, 195 [NASA ADS] [CrossRef] [EDP Sciences] [Google Scholar]
- McLaughlin, M. A., Lyne, A. G., Lorimer, D. R., et al. 2006, Nature, 439, 817 [NASA ADS] [CrossRef] [PubMed] [Google Scholar]
- Michilli, D., Hessels, J. W. T., Lyon, R. J., et al. 2018, MNRAS, 480, 3457 [NASA ADS] [CrossRef] [Google Scholar]
- Mol, J. D., & Romein, J. W. 2011, ArXiv e-prints [arXiv:1105.0661] [Google Scholar]
- Parent, E., Kaspi, V. M., Ransom, S. M., et al. 2018, ApJ, 861, 44 [NASA ADS] [CrossRef] [Google Scholar]
- Pilia, M., Hessels, J. W. T., Stappers, B. W., et al. 2016, A&A, 586, A92 [NASA ADS] [CrossRef] [EDP Sciences] [Google Scholar]
- Pleunis, Z., Bassa, C. G., Hessels, J. W. T., et al. 2017, ApJ, 846, L19 [NASA ADS] [CrossRef] [Google Scholar]
- Rajwade, K., Lorimer, D. R., & Anderson, L. D. 2016, MNRAS, 455, 493 [NASA ADS] [CrossRef] [Google Scholar]
- Ransom, S. M. 2001, PhD Thesis, Harvard University [Google Scholar]
- Ransom, S. M., Eikenberry, S. S., & Middleditch, J. 2002, AJ, 124, 1788 [Google Scholar]
- Ransom, S. M., Stairs, I. H., Archibald, A. M., et al. 2014, Nature, 505, 520 [NASA ADS] [CrossRef] [PubMed] [Google Scholar]
- Ray, P. S., Thorsett, S. E., Jenet, F. A., et al. 1996, ApJ, 470, 1103 [NASA ADS] [CrossRef] [Google Scholar]
- Ray, P. S., Abdo, A. A., Parent, D., et al. 2012, 2011 Fermi Symposium Proceedings – eConf C110509 [Google Scholar]
- Ray, P. S., Wood, K. S., & Wolff, M. T. 2017, ArXiv e-prints [arXiv:1711.08507] [Google Scholar]
- Rickett, B. J. 1970, MNRAS, 150, 67 [NASA ADS] [Google Scholar]
- Rickett, B. J. 1977, ARA&A, 15, 479 [NASA ADS] [CrossRef] [Google Scholar]
- Rickett, B. J. 1990, ARA&A, 28, 561 [NASA ADS] [CrossRef] [Google Scholar]
- Savage, B. D., & Wakker, B. P. 2009, in AIP Conf. Ser., eds. M. E. van Steenberg, G. Sonneborn, H. W. Moos, & W. P. Blair, 1135, 46 [NASA ADS] [CrossRef] [Google Scholar]
- Schnitzeler, D. H. F. M. 2012, MNRAS, 427, 664 [NASA ADS] [CrossRef] [Google Scholar]
- Sobey, C., Bilous, A. V., Grießmeier, J.-M., et al. 2019, MNRAS, 484, 3646 [NASA ADS] [CrossRef] [Google Scholar]
- Spitler, L. G., Cordes, J. M., Hessels, J. W. T., et al. 2014, ApJ, 790, 101 [NASA ADS] [CrossRef] [Google Scholar]
- Staelin, D. H. 1969, IEEE Proc., 57, 724 [NASA ADS] [CrossRef] [Google Scholar]
- Stappers, B. W., Hessels, J. W. T., Alexov, A., et al. 2011, A&A, 530, A80 [NASA ADS] [CrossRef] [EDP Sciences] [Google Scholar]
- Stinebring, D. R., McLaughlin, M. A., Cordes, J. M., et al. 2001, ApJ, 549, L97 [Google Scholar]
- Stovall, K., Lynch, R. S., Ransom, S. M., et al. 2014, ApJ, 791, 67 [NASA ADS] [CrossRef] [Google Scholar]
- Swiggum, J. K., Lorimer, D. R., McLaughlin, M. A., et al. 2014, ApJ, 787, 137 [NASA ADS] [CrossRef] [Google Scholar]
- Tan, C. M., Bassa, C. G., Cooper, S., et al. 2018a, ApJ, 866, 54 [NASA ADS] [CrossRef] [Google Scholar]
- Tan, C. M., Lyon, R. J., Stappers, B. W., et al. 2018b, MNRAS, 474, 4571 [NASA ADS] [CrossRef] [Google Scholar]
- Tauris, T. M., Kaspi, V. M., Breton, R. P., et al. 2015, Advancing Astrophysics with the Square Kilometre Array (AASKA14), 39 [CrossRef] [Google Scholar]
- Thornton, D., Stappers, B., Bailes, M., et al. 2013, Science, 341, 53 [NASA ADS] [CrossRef] [PubMed] [Google Scholar]
- Tyul’bashev, S. A., Tyul’bashev, V. S., Oreshko, V. V., & Logvinenko, S. V. 2016, Astron. Rep., 60, 220 [NASA ADS] [CrossRef] [Google Scholar]
- Tyul’bashev, S. A., Tyul’bashev, V. S., Kitaeva, M. A., et al. 2017, Astron. Rep., 61, 848 [NASA ADS] [CrossRef] [Google Scholar]
- Tyul’bashev, S. A., Tyul’bashev, V. S., & Malofeev, V. M. 2018, A&A, 618, A70 [NASA ADS] [CrossRef] [EDP Sciences] [Google Scholar]
- van Haarlem, M. P., Wise, M. W., Gunst, A. W., et al. 2013, A&A, 556, A2 [NASA ADS] [CrossRef] [EDP Sciences] [Google Scholar]
- van Heerden, E., Karastergiou, A., & Roberts, S. J. 2017, MNRAS, 467, 1661 [NASA ADS] [Google Scholar]
- van Straten, W., & Bailes, M. 2011, PASA, 28, 1 [NASA ADS] [CrossRef] [Google Scholar]
- Verbiest, J. P. W., Lentati, L., Hobbs, G., et al. 2016, MNRAS, 458, 1267 [NASA ADS] [CrossRef] [Google Scholar]
- Yao, J. M., Manchester, R. N., & Wang, N. 2017, ApJ, 835, 29 [NASA ADS] [CrossRef] [Google Scholar]
Appendix A: Additional table
Known pulsars detected by LOTAAS.
All Tables
All Figures
|
Fig. 1. Beam setup of a LOTAAS pointing. Panel a: LOTAAS pointing consists of three sub-array pointings (SAPs) separated by |
| In the text | |
|
Fig. 2. Stereographic projections of the Northern hemisphere in equatorial coordinates (δ > −3°). Lines of equal right ascension and declination are indicated with dashed gray lines (2h steps in RA and 15° in Dec, from 0° to 75°). The Galactic plane is shown as the black curve. Left: observed LOTAAS pointings as of January 2019, following the LOTAAS tessellation scheme. The sky coverage of the incoherent beams is shown for the three passes with different colours. Note that beamsizes have been scaled down for readability of the plot. Right: sky location of the first 73 LOTAAS pulsar discoveries. The period P and dispersion measure DM of the pulsars are indicated with different symbols and colours. Contours show the sky temperature Tsky at 135 MHz, as extrapolated from the Haslam et al. (1982) 408 MHz map, as well as the maximum predicted DM within our Galaxy by the Cordes & Lazio (2002) NE2001 model. |
| In the text | |
|
Fig. 3. Top: pulse broadening due to the finite sampling time, dispersive smearing due to the incoherent dedispersion algorithm used, and the effects of scattering using the scattering relation of Bhat et al. (2004). The diagonal dashed lines denote a one order-of-magnitude larger or smaller range in predicted scattering. Bottom: minimum detectable flux density for the LOTAAS survey as a function of DM. Sensitivity limits are plotted for different pulse periods P, and different system temperatures Tsys. The effect of pulse broadening due to interstellar scattering is shown by the dotted lines. |
| In the text | |
|
Fig. 4. Tied-array beam (TAB) locations for confirmation observations (top) and localization observations (bottom). In these observations a single sub-array pointing is tiled with 127 TABs, where the colour indicates the cumulative signal-to-noise of the pulse profile in each beam. Note the change of scale between the two plots, denoted by the approximate TAB beamsize depicted in the lower left of each panel. In the localization observations the TABs overlap significantly to obtain a signal-to-noise weighted localization of the pulsar. |
| In the text | |
|
Fig. 5. Examples of standard PRESTO diagnostic plots for periodic pulsar candidates. These plots are for LOTAAS discovered pulsars J1529+40, J1635+23 and the binary MSP J1658+36. |
| In the text | |
|
Fig. 6. Pulse profiles of the LOTAAS pulsar discoveries. Shown here are the discovery profiles using 100 pulse profile bins. The pulse profiles are rotated to place the peak at pulse phase ϕ = 0.25. The pulsar name, dispersion measure (in pc cm−3) and spin period (in seconds) are quoted for each pulsar. |
| In the text | |
|
Fig. 7. Measured flux densities ( |
| In the text | |
|
Fig. 8. Top: spin period and DM of pulsars that have been discovered (black dots) and redetected (red circles) in the LOTAAS survey. The size of the circles for the redetected pulsars denotes their flux density. Also plotted as thin grey points are known pulsars from the ATNF pulsar catalogue (excluding pulsars in globular clusters). The solid lines denote the sensitivity limits (in mJy) when taking into account smearing due to dispersion (black), as well as scattering, using the Bhat et al. (2004) (green) and Geyer et al. (2017) (blue) scattering relations. Bottom: cumulative spin period distributions for the pulsars discovered (black) and redetected (red) in the LOTAAS survey. These can be compared to the spin period distribution of pulsars from the ATNF catalogue (dark grey, again excluding pulsars in globular clusters), and when keeping pulsars with P > 0.02 s and DM < 200 pc cm−3 (light grey). The latter distribution can represent the distribution of pulsars that have been redetected in the LOTAAS survey. However, the LOTAAS discoveries tend to have longer spin periods, on average. |
| In the text | |
|
Fig. 9. Distances of LOTAAS discoveries above/below the Galactic plane versus their distance along the Galactic plane, as predicted by the NE2001 (Cordes & Lazio 2002) and YMW16 (Yao et al. 2017) models for the Galactic free electron density distribution. The colour of each point denotes the DM of the pulsar compared to the maximum predicted DM along the particular line-of-sight. The pulsars for which the YMW16 model predicts maximum DMs less than the observed DMs are plotted with black triangles, where the distances to the pulsars are fixed at a limit of 4 kpc above or below the Galactic plane. |
| In the text | |
Current usage metrics show cumulative count of Article Views (full-text article views including HTML views, PDF and ePub downloads, according to the available data) and Abstracts Views on Vision4Press platform.
Data correspond to usage on the plateform after 2015. The current usage metrics is available 48-96 hours after online publication and is updated daily on week days.
Initial download of the metrics may take a while.