| Issue |
A&A
Volume 649, May 2021
|
|
|---|---|---|
| Article Number | A115 | |
| Number of page(s) | 15 | |
| Section | Planets and planetary systems | |
| DOI | https://doi.org/10.1051/0004-6361/202140421 | |
| Published online | 24 May 2021 | |
The young Adelaide family: Possible sibling to Datura?
1
Institute of Astronomy, Charles University,
V Holešovičkách 2,
180 00
Prague 8,
Czech Republic
e-mail: [email protected]
2
Department of Astronomy, Faculty of Mathematics, University of Belgrade,
Studentski trg 16,
11000
Belgrade,
Serbia
3
Southwest Research Institute,
1050 Walnut St, Suite 300,
Boulder,
CO
80302,
USA
Received:
26
January
2021
Accepted:
14
March
2021
Context. Very young asteroid families may record processes that accompanied their formation in the most pristine way. This makes analysis of this special class particularly interesting.
Aims. We studied the very young Adelaide family in the inner part of the main belt. This cluster is extremely close to the previously known Datura family in the space of proper orbital elements and their ages overlap. As a result, we investigated the possibility of a causal relationship between the two families.
Methods. We identified Adelaide family members in the up-to-date catalogue of asteroids. By computing their proper orbital elements we inferred the family structure. Backward orbital integration of selected members allowed us to determine the age of the family.
Results. The largest fragment (525) Adelaide, an S-type asteroid about 10 km in size, is accompanied by 50 sub-kilometre fragments. This family is a typical example of a cratering event. The very tiny extent in the semi-major axis minimises chances that some significant mean motion resonances influence the dynamics of its members, though we recognise that part of the Adelaide family is affected by weak, three-body resonances. Weak chaos is also produced by distant encounters with Mars. Simultaneous convergence of longitude of node for the orbits of six selected members to that of (525) Adelaide constrains the Adelaide family age to 536 ± 12 kyr (formal solution). While suspiciously overlapping with the age of the Datura family, we find it unlikely that the formation events of the two families are causally linked. In all likelihood, the similarity of their ages is just a coincidence.
Key words: celestial mechanics / minor planets, asteroids: general
© ESO 2021
1 Introduction
About 50 asteroid families, for the most part products of the collisions of two parent asteroids, have been identified in the main belt to date (e.g. Nesvorný et al. 2015; Masiero et al. 2015). They represent a wide variety of all kinds of sizes, shapes, spectral types, and/or ages. Large and old families are impressive as they represent the outcomes of enormously energetic collisions. An analysis of their fragments may give us information about the interiors of giant planetesimals in terms of chemical composition and mechanical properties governing the fragmentation process. They are also crucial tracers of the early epochs when the terrestrial planets experienced increased impact flux. However, the analysis of large families may hide difficulties. This is because over the eons since their formation, many dynamical and physical processes might have changed their properties. In addition, large portions of the families may have been lost through major resonances. Disentangling the histories of large families may thus be a great challenge and subject to large uncertainties.
In contrast, the analysis of young families may be more straightforward because the dynamical and physical processes that make them evolve have not had enough time to operate. Therefore, young families are potentially left in a much more pristine state, providing better clues to their formation. Additionally, families younger than about 10 Myr offer a unique possibility of dating their origins using the direct integration of heliocentric orbits of their members backwards in time. This approach, first applied to the Karin family by Nesvorný et al. (2002), may result in age estimations accurate to about ≤10% in relative terms, impossible to achieve for older families. This information may in turn be crucial for potentially linking the family’s formation events to the accretion record of terrestrial planets (e.g. Farley et al. 2006). A possible downside in the study of young young families consists of the typically smaller size of their parent bodies (which are statistically more likely to collisionally disrupt; e.g. Bottke et al. 2005). As a result, fragments forming such families are also typically small objects, many of which may not yet have been discovered by current sky surveys. This aspect is the most severe in very young asteroid families with ages less than 1 Myr, which often consist of only a few known members. The first examples in this category were discovered little more than a decade ago (Nesvorný et al. 2006; Nesvorný & Vokrouhlický 2006). Only two rare cases of very young families with a numerous population of known fragments have been studied in detail so far, the Datura family (e.g. Vokrouhlický et al. 2009, 2017a) and the Schulhof family (e.g. Vokrouhlický & Nesvorný 2011; Vokrouhlický et al. 2016).
Novaković & Radović (2019) reported the discovery of a very young family in the vicinity of the asteroid (525) Adelaide, thence the Adelaide family. In this brief note the authors used backward orbital integration of identified members to infer an approximate age of ≃500 kyr from the dispersion of the nodal longitudes. However, further details about this cluster, including a list of the identified members, were not given. Our interest in the Adelaide family was primarily driven by the suggested age, which seemssuspiciously similar to that of Datura family (Vokrouhlický et al. 2009). Moreover, both families are located in a very similar orbital zone. We considered the proper orbital elements of (1270) Datura (semi-major axis aP = 2.2347 au, eccentricity eP = 0.1535, and sine of inclination sin IP = 0.0920), and compared them with those of (525) Adelaide (semi-major axis aP = 2.2452 au, eccentricity eP = 0.1487, and sine of inclination sinIP = 0.1170). After we reviewed the currently known population of members in the Adelaide family and determined its age using a somewhat more accurate approach (Sect. 2), we discuss its hypothetical relation to the Datura family (Sect. 3). In particular, we considered a case of a causal relationship between them, such that, for instance, the Adelaide family formed first and soon afterwards a coherent stream of its fragments hit the parent asteroid of the Datura family. If true, this would be the first chain reaction between asteroids ever described.
2 Adelaide family
2.1 The largest fragment
The largest fragment in this cluster, (525) Adelaide, is the only asteroid with some physical characterisation available. Masiero et al. (2014) analysed WISE/NEOWISE infrared observations and reported Adelaide’s size D = 9.33 ± 0.24 km and geometric albedo pV = 0.22 ± 0.05. These results assume an absolute magnitude H = 12.4 mag in the visible band. More up-to-date absolute magnitude determinations across all standard databases (such as MPC, JPL, or AstDyS) indicate a slightly smaller value of absolute magnitude: H ≃ 12.1. The difference of about 0.3 magnitude is a characteristic scatter in this parameter reported by Pravec et al. (2012), who also noted that near H ≃ 12 mag the systematic offset of the database-reported values should be small (becoming as large as − 0.5 mag for smaller objects). It is therefore possible that the true size of (525) Adelaide is slightly larger, its geometric albedo slightly higher, or a combination of both. The answer will be found when photometrically calibrated data of this asteroid are taken. Luckily, this issue is not critical for our analysis. With a safe margin we can assume Adelaide’s size to be between 9 and 11.5 km, and the geometric albedo between 0.22 and 0.29. This albedo range closely matches the characteristic value in the Flora family region of the inner main belt. Nesvorný et al. (2015) identified (525) Adelaide as a member in the Flora family despite the proper inclination value of its orbit being at the high end of the Flora family members. Nevertheless, whether Adelaide is a fragment from the Flora-family formation event, which took part more than 1 Gyr ago (e.g. Vokrouhlický et al. 2017b), is again not a crucial issue for our study. The confirmation of this albedo value also comes from broad-band photometry of (525) Adelaide taken by the Sloan Digital Sky Survey (SDSS) project. Considering the methodology in Parker et al. (2008), we used the SDSS-based observations to infer its colour indexes a* = 0.108 and i − z = −0.08. Given the information in Fig. 3 of Parker et al. (2008) we concluded that these values are characteristic of S-complex asteroids. This is a prevalent spectral type in the Flora zone, and the characteristic albedo values of these objects very closely match those given for (525) Adelaide.
From what we know we can thus assume (525) Adelaide is a typical S-type object in its orbital region. This information also helps to estimate its bulk density to be between 2.2 and 3.2 g cm−3 (e.g. Scheeres et al. 2015). As a result, a characteristic value of the escape velocity from (525) Adelaide would safely be in the 5–10 m s−1 range of values. Finally, Pilcher (2014) photometrically observed (525) Adelaide during its 2014 apparition. From these data, he inferred the rotation period to be P = 19.967 ± 0.001 hr and rather low amplitude 0.35 ± 0.03 mag of the light curve. This indicates Adelaide is a slowly rotating asteroid likely having a near-spherical shape, justifying the above-mentioned simple estimate of the escape velocity (based on a spherical shape assumption).
2.2 Family identification
Asteroid families are traditionally identified as statistically significant clusters in the space of proper orbital elements: semi-major axis (aP), eccentricity (eP), and sine of inclination (sinIP) (e.g. Knežević et al. 2002). The hierarchical clustering method (HCM) is the most often adopted tool to discern these clusters (though there are also other, less employed approaches) and to evaluate their statistical significance (e.g. Bendjoya & Zappalà 2002; Nesvorný et al. 2015). This requires us to introduce a metric function in the three-dimensional space of proper elements in order to evaluate the distance between two asteroid orbits, and to analyse both the family population and the background populations of asteroids. It was realised that a problem may occur for very young families with only a limited number of known members; in these cases it may be difficult to prove the statistical significance of the family among the plethora of interloping background objects. Nesvorný et al. (2006) and Nesvorný & Vokrouhlický (2006) observed that the problem occurs due to the low dimensionality of the proper element space, and proposed that working in a higher dimensional space may help solve the issue. At the same time, they noted that collisionally born clusters initially have very tightly clustered longitude of node Ω and perihelion ϖ, in addition to semi-major axis a, eccentricity e, and inclination I, and that it takes only about 1−2 Myr to make these secular angles disperse into a whole range of possible values. Therefore, very young families (aged less than 1− 2 Myr) could be identified directly in a five-dimensional space of osculating orbital elements, excluding only longitude in orbit (which disperses much faster, on approximately a thousand-year timescale; see also Rosaev & Plávalová 2018, where the concept of very young families is also discussed). In order to follow classical lines of family identification, Nesvorný & Vokrouhlický (2006) introduced an empirical metric in the (a, e, I, Ω, ϖ) space and used the HCM method. However, the metric extension to secular angles (Ω, ϖ) is only approximate (see also Rożek et al. 2011), and this could introduce uncertainties. For this reason, we actually decided to use a more straightforward but robust approach.
We constructed a simple box-zone in the space of the osculating elements (a, e, I, Ω, ϖ) around the nominal orbit of (525) Adelaide. The box was defined using uncorrelated variation in each of these elements by the following values: semi-major axis ± 0.01 au, eccentricity ± 0.01, inclination ± 0.1°, longitude of node and argument of perihelion ±30°. These values are far larger than the orbital uncertainty of (525) Adelaide, which justifies using its nominal (best-fit) orbit at this stage. We used the MPCORB.DAT database of asteroid orbits provided by the Minor Planet Center, which contained more than a million entries as of February 2021. We found 52 objects, including (525) Adelaide, in our target box. Importantly, these asteroids are not distributed uniformly in this zone, but are rather tightly clustered near its centre. As an example, the longitude of node values are clustered around Adelaide’s value within the interval − 7° to + 2°. This is much less than the box limits ±30°. Similarly, all semi-major axes values are within the interval − 0.002 au and + 0.002 au around Adelaide’s value, while the target box had a ±0.01 au allowance. In both cases the orbital parameter values occupy about one-fifth of the target zone. A similar situation occurs for the remaining three elements. Another important aspect consists of a correlation between various elements in the box. For instance, the longitude of node is anticorrelated with the longitude of perihelion for the objects found. Similar anticorrelation occurs between the longitude of node and inclination, and the longitude of perihelion and eccentricity. These correlations indicate that this group of objects has something in common, rather than being a random sample of asteroids (for the correlation of the secular angles in the case of a young Datura family, see Fig. 12 in Vokrouhlický et al. 2017a). Finally, we note that asteroid (159 941) 2005 WV178 is systematically at the border of the cluster in all elements, and therefore it is a suspected interloper.
To further justify membership in the Adelaide family, we numerically propagated backwards in time the nominal orbits of (525) Adelaide and the set of 51 candidate asteroids from the cluster found in the target box. For the sake of simplicity we included gravitational attraction by the Sun and perturbations from planets, but neglected other effects such as the thermal accelerations at this stage. Our integration spanned a 2 Myr time interval from the current epoch backwards in time. We used a well-tested swift package1 that efficiently implements N-body propagation using the first order symplectic map of Wisdom & Holman (1991). We used a short timestep of three days and output the state vectors of all propagated bodies, planets, and asteroids, every five years for further analysis. We monitored differences δΩ =Ω − Ω525 and δϖ = ϖ − ϖ525 between the orbits ofidentified fragments and (525) Adelaide. In contrast to similarly defined differences in semi-major axis, eccentricity, and inclination, δΩ and δϖ are subject to secular evolution, clearly detectable on a million-year timescale. This is because proper nodal and pericentre frequencies s and g are slightly different, even across a compact family such as Adelaide (see Table A.2). As already mentioned, the present-day values range in an interval of approximately ±10°, while the low-velocity dispersal at the origin of the family must have resulted in δΩ and δϖ not larger than a fraction of a degree. So, in principle, the current configuration of proposed asteroids in the Adelaide family is incompatible with the initial state, but if things work well the initial state might be achieved by past simultaneous convergence of δΩ and δϖ to near zero values. The benefit of a success in a similar numerical experiment is twofold; first, it proves a candidate asteroid is a true member in the family, and second, the epoch of convergence can be identified as the origin of the family. This procedure has been used since the discovery of the Karin family (Nesvorný et al. 2002), and applied to very young asteroid families since the work of Nesvorný et al. (2006) and Nesvorný & Vokrouhlický (2006).
In order to proceed step-by-step, however, we first perform a less ambitious task. At this moment we analyse δΩ and δϖ individually for each of the candidate asteroids in the Adelaide family, without combining them into a global picture. Therefore, at this stage we are not aiming to determine the age of the Adelaide family; our primary goal is to eliminate interloper objects from our candidate list. These interlopers will not show any signs of convergence of δΩ and δϖ to zero at approximately the same time.
An example of a successful convergence test for asteroid (452 322) 2000 GG121 is shown in Fig. 1. The simultaneous crossing of zero of the angular difference with (525) Adelaide occurs at ≃ 550 kyr ago, in a close agreement with the suggested age of Adelaide in Novaković & Radović (2019). In spite of some oscillatory patterns2, both δΩ and δϖ behave approximately linearly in time. Moreover, the slope of this linear trend closely matches the difference in proper frequencies s and g determined for (525) Adelaide and (452 322) 2000 GG121 in Table A.2. For instance, δΩ ≃(s452 322 − s525) t with s452 322 − s525 ≃−4.8 × 10⁻²′′ yr−1 (the positive slope in Fig. 1 is explained by time going into the past at the abscissa), and similarly for δϖ. The difference inthe proper frequencies is mainly due to the difference in the proper semi-major axes of these two asteroids (Table A.1), which is among the largest in the family. It is worth noting that the nodal behaviour at the crossing condition δΩ =0 is smooth and well behaved. On the contrary, even though the δϖ = 0 condition occurs at about the same epoch, the perihelion convergence suffers oscillatory terms. We assume this is due to a slight offset in proper eccentricity values between (525) Adelaide and (452 322) 2000 GG121 (Table A.1). Figure 2 shows another successful convergence test, this time for asteroid 2016 GO11. Its proper semi-major axis is among the smallest in the family (Table A.1), at the opposite extreme to (452 322) 2000 GG121 discussed above. For this reason, the linear approximation of δΩ and δϖ now have opposite trends. Nevertheless, both δΩ ≃ 0 and δϖ ≃ 0 occur again at about 510 kyr ago, closely compatible with the proposed age of the family, and again the perihelion convergence suffers a jitter by periodic terms related to an offset in proper eccentricity. About one-third of the asteroids in our candidate sample exhibited this excellent type of secular angle convergence.
Another group of candidate asteroids showed behaviour that was a little worse than δΩ and δϖ, although still acceptable. A representative of this class, asteroid (475 474) 2006 SZ152, is shown in Fig. 3. While a simultaneous convergence of nodes and pericenters is not apparent here, δΩ and δϖ both remain very small (within a degree limit in this case) for the past ≃ 600 kyr. Even the starting values are currently very small, reflecting the close proximity of the orbit of (475 474) 2006 SZ152 to (525) Adelaide (see the aP values listed in Table A.1). We are positive that in these cases, convergence near 500 kyr ago can be achieved when the effect of thermal accelerations (the Yarkovsky effect) are included in the simulation. As discussed in Sect. 5 of Vokrouhlický et al. (2017a), the Yarkovsky effect would present an additional quadratic trend in δΩ and δϖ. For instance, in the nodal case δΩYar ≃ 0.5 (∂s∕∂a) ȧ t2, where (∂s∕∂a) ≃38′′ yr−1 au−1 in the Adelaide family zone and ȧ is the semi-major axis secular drift of (475 474) 2006 SZ152 due to the Yarkovsky effect. Unfortunately, ȧ is not known for any of the Adelaide small members, and given their estimated size and heliocentric distance, it may be any value within ± 6 × 10⁻⁴ au Myr−1 (e.g. Bottke et al. 2006; Vokrouhlický et al. 2015). With t ≃ 500 kyr, the Yarkovsky effect contribution to the nodal convergence condition may be within the range δΩYar ≃ ±1°. A similar contributionis also possible to the perihelion convergence. The Yarkovsky effect may also contribute in the convergence of asteroids (452 322) 2000 GG121 and 2016 GO11 shown in Figs. 1 and 2, but it clearly cannot explain the full range of the present-day δΩ and δϖ spanning several degrees. In these cases simulation without the thermal accelerations have already provided a nicely consistent picture of the past convergence and it primarily derives from a distant-enough location of their orbits from (525) Adelaide.
Finally, (159 941) 2005 WV178 was the only case that was found to be orbitally dissimilar to (525) Adelaide in the past 2 Myr. This confirms our earlier suspicion that this object is unrelated to the Adelaide family, and we further confirm this conclusion by computation of its proper elements in the appendix. Our working list of known members in the Adelaide family is given in Table A.1.
Once we have resolved the question of the Adelaide family membership, we can analyse several population characteristics. We start with the simplest case, namely the distribution of absolute magnitude values (equivalent to the size distribution, if the albedo is constant). The data in Table A.1 indicates that (525) Adelaide is the only sizable object in the family and all remaining asteroids are much smaller. Assuming pV = 0.22 (see Sect. 2.1), the sizes range between ≃0.43 km and ≃0.71 km, but slightly smaller sizes are also possible if the geometric albedo is actually larger. Figure 4 shows the cumulative distribution N(< H) of absolute magnitude H. Omitting (525) Adelaide itself, N(< H) can be approximated using a power law N(< H) ∝ 10γH with γ ≃ 1.8. The extreme size difference between the largest fragment and the second largest fragment, and the very steep power-law exponent γ imply the Adelaide family results from a significant cratering event on Adelaide itself. The N(< H) distribution resembles that of other cratering-born families such as Vesta or Massalia. It should also be noted that the slow rotation of (525) Adelaide (Sect. 2.1), and the limited mass of the sub-kilometre-sized fragments, imply the Adelaide family cannot form by a rotational fission of its parent body (see Pravec et al. 2018).
Because the obvious observational incompleteness of sub-kilometre-sized asteroids in the main belt, we wondered if we were missing some larger Adelaide fragments than those listed in Table A.1. However, we consider this possibility unlikely as several studies place the observational completeness limit at the Adelaide zone between 17 and 18 magnitude. For instance, Vokrouhlický et al. (2017a) evaluated the completeness of Catalina Sky Survey observations taken between 2005 and 2012 for Datura family members (whose orbits are very similar to those of Adelaide). They found that the Datura population is basically complete at ≃16.8 mag from just this survey. Hendler & Malhotra (2020) followed a more empirical approach, using all the data combined as of 2020 to estimate population completeness limit as a simple function of the semi-major axis. They obtained ≃ 17.5 mag limit at the Adelaide zone. As a result, it seems unlikely that we are missing any large fragments in the Adelaide family. Obviously, the population beyond magnitude 18 becomes gradually less complete, and our set of 50 fragments with H between 18 mag and 19 mag may represent just a fraction of the true population.
 |
Fig. 1 Orbital convergence of secular angles for the nominal orbits of (452 322) 2000 GG121 and (525) Adelaide: (i) difference in longitude of node δΩ = Ω452 322 − Ω525 (red line), (ii) difference in longitude of perihelion δϖ = ϖ452 322 − ϖ525 (blue line)(osculating values in both cases). The abscissa is time to the past (in kyr). At approximately 500 kyr ago, both secular angles of (452 322) 2000 GG121 converge to the respective values of (525) Adelaide. |
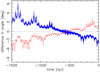 |
Fig. 2 Orbital convergence of secular angles for the nominal orbits of 2016 GO11 and (525) Adelaide: (i) difference in longitude of node δΩ = Ω2016 GO11 − Ω525 (red line), (ii) difference in longitude of perihelion δϖ = ϖ2016 GO11 − ϖ525 (blue line)(osculating values in both cases). The abscissa is time to the past (in kyr). At approximately 500 kyr ago, both secular angles of 2016 GO11 converge to the respective values of (525) Adelaide. |
 |
Fig. 3 Orbital convergence of secular angles for the nominal orbits of (475 474) 2006 SZ152 and (525) Adelaide: (i) difference in longitude of node δΩ = Ω475 474 − Ω525 (red line), (ii) difference in longitude of perihelion δϖ = ϖ475 474 − ϖ525 (blue line) (osculating values in both cases). The abscissa is time to the past (in kyr). The secular angle differences stay very small for the past ≃ 600 kyr (within about one degree), but the precise nature of the convergence is not as good as in the previous two figures because of the likely contribution of the Yarkovsky acceleration in the orbital evolution of the smaller asteroid (475 474) 2006 SZ152 (see text). |
 |
Fig. 4 Cumulative distribution N(< H) of absolute magnitude H for known Adelaide family members. The diamond symbol denotes the largest fragment (525) Adelaide, filled circles are smaller fragments in the family. The grey line shows the power-law relation N(< H) ∝ 10γH for γ = 1.8, which approximates the distribution of small members. The upper abscissa provides an estimate of size, assuming geometric albedo pV = 0.22 (a possiblevalue for (525) Adelaide; Sect. 2.1). The sizes would be slightly smaller for larger pV values. |
2.3 Proper element determination for the Adelaide cluster
The family identification in the previous section circumvents proper orbital elements. However, it is still very useful to determine these elements because they may reveal some details about family structure. They represent yet another independent step in the justification for family membership because a potentially young family must be extremely compact in the space of proper orbital elements, even more than in the respective osculating elements.
We used synthetic proper elements (aP, eP, sinIP) defined by purely numerical means (e.g. Knežević & Milani 2000, 2003). A world-wide database of the asteroid proper elements is maintained at the website AstDyS3, run by a consortium of institutions lead by the University of Pisa. However, the information at AstDyS is not up-to-date, and does not provide proper elements for all the asteroids in the Adelaide family. For this reason we determined the proper elements ourselves, using the methods described in the appendix. Results for (aP, eP, sinIP) and their formal uncertainty, are provided in Table A.1. Proper frequencies of node and perihelion (s, g) and their formal uncertainty are listed in Table A.2. In a few cases of asteroids observed in only two or three oppositions, the formal semi-major axis uncertainty δaP may underestimate the realistic value (see the discussion in the appendix for more examples and details). For instance, the orbit with the least observational data (2015 TD44, which has only 25 astrometric observations during two oppositions in 2015 and 2020) has an osculating semi-major axis uncertainty δa ≃ 12.6 × 10⁻⁶ au, about four times larger than the formal δaP ≃ 3.3 × 10⁻⁶ au (computed from the nominal osculating orbit). While we admit this slight inconsistency, we are fortunate that it does not have any impact on our conclusions. We note that the formal uncertainties on proper eP and sin IP are always larger than the uncertainties on the respective osculating e and I for multi-opposition asteroids. A special category in this respect comprises the four single-opposition objects in the family: 2016 UO110, 2017 RS100, 2019 TC62, and 2019 YE29. In these four cases the osculating orbits have uncertainty values that are larger than the stated values of the respective proper elements; the worst situation is for 2017 RS100 observed over a nine-day arc only resulting in an osculating semi-major axis uncertainty of δa ≃ 7.5 × 10⁻³ au. We include these four objects for the sake of completeness, but again their omission is not important for any of our conclusions.
Figure 5 shows the projection of the Adelaide family members onto a plane defined by two proper elements, semi-major axis aP vs. sine of inclination sin IP in the top panel, and semi-major axis aP vs. eccentricity eP in the bottom panel. As expected, the family is extremely compact and all the proposed members reside in the space of proper elements at a satisfactory distance from the orbit of (525) Adelaide. This is quantitatively expressed by a velocity distance of 6 m s−1 (the lower estimated limit for the escape velocity of this asteroid; Sect. 2.1) shown by the dashed ellipses in both panels of Fig. 5. For the sake of simplicity, the velocity distance in the proper element space used here assumes an isotropic ejection field, and requires a choice of the true anomaly f and argument of perihelion ω at the epoch of the formation of the family (a priori unknown parameters). We set f =90° and ω + f = 0°, which conforms well to the distribution of the Adelaide fragments. With these characteristics, all the fragments must land inside the dashed elliptical zones. The fragments at the opposite extreme distances to (525) Adelaide in terms of proper semi-major axis are highlighted by boxes A and B. The asteroid (452 322) 2000 GG121, whose nominal orbit convergence is shown in Fig. 1, is representative of objects in box A, while the asteroid 2016 GO11, whose nominal orbit convergence is shown in Fig. 2, is representative of objects in box B. The members in these groups have accumulated the largest differences in present-day osculating longitude of node and perihelion with respect to (525) Adelaide. About 12 additional members lie in the immediate vicinity of (525) Adelaide in terms of proper semi-major axis (namely within δaP≃ ±0.0002 au). The asteroid (475 474) 2006 SZ152, whose nominal orbit convergence is shown in Fig. 3, represents this class of fragments. Their orbits have small differences in osculating secular angles from those of (525) Adelaide. As discussed above, adjusting their exact convergence critically requires the contribution of the Yarkovsky effect. Finally, more than half of the small fragments (26 of 50) in the family reside in a narrow zone delimited by proper semi-major axis values 2.2455 au and 2.2458 au. This region appears anomalous in the Adelaide family because of the statistically significant concentration of members, and for two other characteristics4: (i) in this strip the proper semi-major axis uncertainty has elevated values for many asteroids (with maximum of δaP ≃ ±1.6 × 10⁻⁴ au, about an order of magnitude higher than in other zones of the family), and (ii) the proper eP and sin IP values are the most dispersed. In order to understand what condition may be special in this zone, we conducted a search in the catalogue of mean motion resonances with planets compiled by Gallardo (2006) and Gallardo (2014). None of the prominent resonances crosses the Adelaide family, but we found a few very weak three-body resonances (e.g. Nesvorný & Morbidelli 1998a,b) located exactly in the suspicious strip of anomalous behaviour. The strongest of them is 15J-11S-3 at ≃ 2.24576 au, and there are two even weaker resonances (14J+9S-5 and 8J+2E-9 at ≃ 2.2455 au and ≃ 2.2456 au; see Fig. 5). Interaction with these resonances, in particular jumps between their multiplets, can produce a direct perturbation in proper semi-major axis and may serve as a pre-requisite of the observed anomaly.
While inspecting the effect of mean motion resonances, we noticed yet another process that operates in the Adelaide family, namely an overall weak chaos due to distant encounters with Mars. The osculating eccentricity temporarily exceeds ≃ 0.23, making the osculating perihelion less than ≃1.73 au, with a period of ≃280 kyr related to the g − g6 frequency (Fig. 6). At the current epoch, planet Mars is at the peak of its secular eccentricity variations, with its aphelion periodically exceeding 1.7 au. The principal period here is ≃95 kyr, corresponding to the planetary frequencies g4 − g5. There are also long-period cycles in the Mars eccentricity making its maximum perihelion distance reach only ≃ 1.62 au about 1.3 Myr ago related to the planetary frequencies g4 − g3 (Fig. 6). The difference between an asteroid’s perihelion and the Mars aphelion distance, which may be currently small (≤ 0.03 au), does not necessarily imply close-enough encounters. These encounters occur in three-dimensional Cartesian space and more well-tuned conditions must be satisfied. We find of particular importance the value of secular angles that span an interval up to 10°, as in the current epoch. The values of secular angles correlate with the values of the semi-major axis, and this may help explain why the encounter influence is greater in specific zones of the family. To further illustrate the potential role of Mars encounters in the Adelaide family, we note that it is located right at the bottom of the 100 Myr scale instability strip shown in Fig. 8 of Morbidelli & Nesvorný (1999). The orbits located in this zone evolve due to the conjoint effect of weak resonances and Mars encounters on this timescale. The Adelaide family is just barely safe from a more violent evolution.
In an attempt to understand things in more detail, we selected the orbits of six numbered members of the Adelaide family and integrated their orbits backwards in time for 2 Myr (results shown in Fig. 6). These orbits include some examples from the critical zone of proper semi-major axes between 2.2455 au and 2.2458 au, and also orbits beyond. In this set of simulations, we also paid particular attention to the physical distance to Mars, which was monitored every year. We found that basically all orbits exhibit distant encounters with this planet. The closest registered encounters were at a distance of ≃ 0.11 au, about 18 Hill radii. All significant encounters occurred within the past 700 kyr when Mars had a large-enough perihelion distance (top panel at Fig. 6). To our surprise, we did not find much closer encounters for orbits with aP in between 2.2455 au and 2.2458 au. For instance, the orbit of (475 474) 2006 SZ152 (in green) has only slightly more distant encounters than that of (534 611) 2014 UC204 (in magenta). However, there is a significant difference in the behaviour of their mean semi-major axes ā : 475 474 is markedly stable, with only tiny jitter in ā; the orbit of 534 611 exhibits the largest jump in ā at about 700 kyr (the epoch of a comparably distant Mars encounter for both orbits). We thus conclude that the direct effect of the encounter on ā is small in both cases. However, what makes the difference is the underlying dynamical landscape. In particular, even a tiny change in ā may drive the orbit of 534 611 across different multiplets of the weak mean-motion resonances, depending on the particular phase of their oscillations. We recall that resonance width is a strong function of orbital eccentricity (e.g. Murray et al. 1998; Nesvorný & Morbidelli 1998a), and this increases their role at the epochs when perihelion attains minimum values. Thus, the conjoint effect of the Mars encounters and the mean-motion resonances is the reason for the macroscopically noticeable chaos at 2.2455 au and 2.2458 au. This also means that this zone acts as an attractor, capable of capturing the orbits by their chaotic mixing, and this produces their apparent concentration in the space of proper orbital elements (Fig. 5).
The data in Table A.1 also indicate that characteristic uncertainties on eP and sin IP are fairly uniform across the Adelaide family: ≃7.5 × 10⁻⁴ and ≃3.0 × 10⁻⁴, respectively. These are not unusually high values compared to the global distribution of these uncertainties in the main belt population (e.g. Knežević et al. 2002), but they are so apparent in Fig. 5 partly because of the extreme compactness of Adelaide family in these parameters. However, some amplification in δeP and δ sin IP is due to the aforementioned effect of distant encounters with Mars.
Finally, we recall that the proper elements are constructed using a conservative model that includes only the gravitational accelerations of the Sun and planets in an asteroid’s equations of motion. However, sub-kilometre-sized Adelaide fragments might be affected by thermal accelerations (the Yarkovsky effect) to a noticeable level, even on the timescale as short as ≃ 500 kyr suggested by Novaković & Radović (2019). In particular, the Yarkovsky effect may result in a secular drift in proper semi-major axis accumulating up to ≃±3 × 10⁻⁴ au over that timescale (e.g. Bottke et al. 2006; Vokrouhlický et al. 2015). This is shown with the grey arrows on the top panel of Fig. 5. Therefore, the current family configuration may not exactly reflect the initial state since some fragments might have been shuffled left or right in Fig. 5. Over the course of this migration process some fragments might have also been temporarily trapped in the zone of mean motion resonances. However, our tests show that this happens only for slowly drifting fragments. This occurs because none of the resonances crossing the family is particularly strong and the concentration seen in Fig. 5 is truly an apparent feature of the way the proper elements are determined.
 |
Fig. 5 Adelaide family represented by two possible plane-projections of proper orbital elements: (i) semi-major axis aP vs. sine of inclination sinIP (top panel), and (ii) semi-major axis aP vs. eccentricity eP (bottom panel). Shown are the largest fragment (525) Adelaide (diamond) and the smaller family members (black filled circles for multi-opposition orbits, grey for single-opposition orbits). The vertical and horizontal bars are the formal uncertainty values of the proper elements from Table A.1. The vertical grey stripes indicate the locations of several weak mean motion resonances (from left to right): 14J+9S-5, 8J+2E-9, and 15J-11S-3; the width of the line approximates resonances strength at the value of proper eccentricity using Gallardo (2014). Boxes A and B contain asteroids whose orbits are well separated from (525) Adelaide, suitable for dating family origin using backward integrations (see Sect. 2.4). The grey arrow in the top panel gives an estimate of maximum drift in semi-major axis of a ≃ 0.5 km asteroid, typical of many small members in the family (Fig. 4), in 500 kyr. The grey dashed ellipses indicate proper element zones in which fragments may land if ejected from (525) Adelaide with 6 m s−1 velocity (assuming true anomaly f = 90° and argument of perihelion such that ω + f = 0° at origin). |
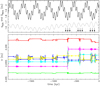 |
Fig. 6 Top panel: osculating perihelion distance of (525) Adelaide’s nominal orbit (black) and the osculating aphelion distance of Mars (grey) vs. time into the past. Adelaide’s orbital behaviour is representative, at this level, of all members in the family. The arrows indicate epochs of local minima of Adelaide’s perihelion distance if ≤ 1.8 au during the past 700 kyr. Bottom panel: mean semi-major axis ā of six selected members of the Adelaide family: (452 322) 2000 GG121 in red; (475 474) 2006 SZ152 in green; (504 375) 2007 VV73 in blue; (517 580) 2014 UZ170 in cyan; (534 611) 2014 UC204 in magenta; and (545 614) 2011 SA45 in yellow. The mean value of the semi-major axis was obtained from the osculating value by digitally filtering short-period terms (periods ≤ 300 yr). The distinct jumps in ā correlate with the minima at the perihelion distance (therefore maxima of the orbital eccentricity), suggesting that shallow Mars encounters along with resonant perturbations are the responsible mechanism. |
2.4 Adelaide family’s age
The numerical integrations that served in Sect. 2.2 to support the identification of the Adelaide family’s members, represent a template for the estimation of the family’s age. However, they need to be improved in several respects (see Nesvorný & Vokrouhlický 2006, for further details of the method).
Firstly, instead of using the behaviour of secular angles with respect to (525) Adelaide for each of the family members individually,we needed to monitor a simultaneous convergence of orbits for as many members as possible (ideally all of them). We selected an educated sample of Adelaide members. This not only decreased the CPU requirements, but also eliminated orbits that would otherwise be problematic. Our choice is presented below.
Secondly, the identification of the family’s origin from the orbital convergence some tens to hundreds of thousands of years ago, hinged on how accurately we were able to reconstruct the orbits in the past. This, in turn, depended on two aspects: (i) the accuracy of the orbits at the present epoch as reconstructed from the observations, and (ii) the accuracy of the dynamical model used to propagate the orbits backwards in time. Each of these aspects is limited and needs to be compensated for in the simulations. The first issue was treated by representing the initial conditions for orbit integration using a multitude of geometrical clones roughly located in the six-dimensional uncertainty ellipsoid obtained from the orbital determination. The main deficiency of the dynamical model is the absence of constraints on the thermal accelerations (the Yarkovsky effect). Each of the propagated orbits needs to be assigned a value of the Yarkovsky effect, but these range in the interval of values that can be estimated from an asteroid’s size and heliocentric distance. These are the Yarkovsky clones in our simulation. In order to simplify our simulations we neglected the geometric clones and adopted only the nominal (best-fit) orbits. This is clearly justified by noting that for small objects, like members of the Adelaide family, the perturbation from the Yarkovsky effect far surpasses the orbital diversity due to geometrical clones. For each of the small members in the family, we considered 35 Yarkovsky clones, each sampling uniformly semi-major axis drift rate values in the range ± 6 × 10⁻⁴ au Myr−1. This value was estimated for ≃0.6 km asteroids at Adelaide’s heliocentric distance (e.g. Bottke et al. 2006; Vokrouhlický et al. 2015). Since the diurnal variant of the Yarkovsky effect dominates, the negative or positive d a∕dt values assigned to the Yarkovsky clones imply a retrograde or prograde sense of rotation. The maximally drifting clones accumulate a change in proper semi-major axis in 500 kyr, as shown in the top panel of Fig. 5. For the sake of simplicity, we disregarded the Yarkovsky clones for (525) Adelaide because of its much larger size. Since the Yarkovsky effect is only represented by a value, namely the semi-major axis drift-rate, we did not implement its physically rooted, sophisticated representation, as was done in Vokrouhlický et al. (2000). We instead represented the Yarkovsky effect using a simple transverse acceleration, resulting in the required semi-major axis drift, as in Nesvorný & Vokrouhlický (2006).
Thirdly, we needed to quantify the success in the convergence of orbits in our numerical experiment. This was again done using the formula from Nesvorný & Vokrouhlický (2006), who defined a target function
 (1)
(1)
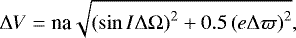
where na ≃ 19.9 km s−1, e and sin I are orbital eccentricity and inclination (we considered the osculating values of (525) Adelaide at a given epoch), and ΔΩ and Δϖ are dispersal values of longitude of node and perihelion. These quantities are defined as 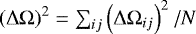 , where ΔΩij are simple differences in osculating nodal longitudes of a particular clone for ith and jth objects, and N is the number of pair combinations between the asteroids tested (and similarly for perihelia). The function ΔV has a dimension of velocity and approximates a characteristic velocity change between the orbits at a given time, based only on Gauss equations and the information in secular angles. At the origin of the Adelaide family, we expect ΔV at the level (or less) of the escape velocity from (525) Adelaide. As a result, we used ΔV ≤ 6 m s−1 as a criterion to characterise a successful orbital convergence.
In the course of initial tests we noticed a problem with the perihelion segment in the target function (1). As already noticed in the examples given in Figs. 1 and 2, the longitude in perihelion tends to exhibit short-period oscillations near the convergence configuration and their amplitude exceeds the 6 m s−1 limit on ΔV. This is due to the sizable scattering of the proper eccentricities of the small members in the Adelaide family compared to the proper inclination values. This behaviour is most likely related to dynamical perturbation due to Mars encounters that projects in eccentricity more than inclination. Since it is not possible to exactly reproduce the effects of the Martian encounters in our simulation, we decided to truncate the contribution from perihelia in the target function (1). We thus used a simplified version, ΔV′ = na sinI (ΔΩ), and kept the convergence criterion ΔV′≤ 6 m s−1. While easier to satisfy, we recall it is still a very strict limit: plugging in sin I ≃ 0.117 from the respective proper value (Fig. 5), the ΔV′≃ 6 m s−1 level corresponds to a nodal dispersion of only ΔΩ ≃ 0.15°.
We now return to the selection of asteroids used in the numerical simulation targeting at the age determination for Adelaide family. We included the largest fragment (525) Adelaide (nominal orbit and we neglected the Yarkovsky effect). In Sect. 2.2, we identified the objects most distant from (525) Adelaide in proper semi-major axis as suitable candidates for family age determination; in these cases the dominant part of the secular angle difference with respect to (525) Adelaide is simply due to their position in the family. The badly constrained contribution from the Yarkovsky effect is smaller. In Fig. 5, we highlight these members with boxes A and B. These are the objects used in our simulation. In order to alleviate CPU demands, we only excluded the poorest defined orbit from each of the boxes. As a result the collection of small fragments used in our experiment was as follows: (i) in box A we used (452 322) 2000 GG121, 2014 JY105, and 2015 RM186 (excluding 2017 HL72 and 2019 TC62), and (ii) in box B we used 2015 TD44, 2016 CX104, and 2016 GO11 (excluding 2017 WP50). The other members in the family may present difficulties that we intend to avoid in this work. For instance, asteroids too close to (525) Adelaide (see Fig. 3) typically have the largest portion of accumulated difference in secular angles due to the Yarkovsky effect. Even though we consider it in our simulations, the limited number of Yarkovsky clones may not guarantee the accuracy of the result. Similarly, all asteroids in the chaotic strip affected by mean motion resonances and significant perturbations from Mars encounters (Sect. 2.3) may also lead to inaccurate results.
We were thus left with seven asteroids in our numerical simulation: (525) Adelaide, three members in box A (each represented 35 Yarkovsky clones), and three members in box B (each represented 35 Yarkovsky clones). The simulation covers an interval of 1 Myr into the past. Similarly to the simple convergence tests reported in Sect. 2.2, we used the swift code for orbit propagation. Perturbations from all planets were taken into account, and here we also implemented thermal accelerations (the Yarkovsky effect) using a fictitious transverse acceleration providing the predicted secular change in the semi-major axis (for details of the method, see Nesvorný & Vokrouhlický 2006). The assigned drifts uniformly ranged in the interval  , where
 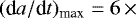 10−4 au Myr−1 is the estimated zero-obliquity value for a 0.6 km asteroid at the Adelaide heliocentric distance (see Bottke et al. 2006, and Sects. 2.2 and 2.3 above). The timestep was three days and output frequency one year. Every year we consulted the configurations of all the particles, and for all the possible 356 ≃ 1.84 × 10⁹ combinations of the clones of small Adelaide members and (525) Adelaide we evaluated the target function ΔV′. When we encountered a configuration satisfying ΔV′≤ 6 m s−1, we noted the epoch and identified the clones that converged. This information tells us the expected strength of the Yarkovsky effect, and we interpreted this information in terms of the predicted sense of rotation.
Figure 7 shows the results from our simulation. The median value of the convergence of the epochs was 536 kyr. Sorting the convergence epochs in an increasing manner, we obtained a cumulative distribution of successful clone combinations. We opted to define the age uncertainty by setting 5 and 95% limits of the cumulative distribution,which gave us 536 ± 12 kyr for the Adelaide family5. Additionally, noting which of the clones contributed to the converging configurations, we plotted the distributions of the empirical Yarkovsky drift da∕dt assigned to the particular clone for each of the asteroids in the experiment. Since the diurnal variant of the Yarkovsky effect dominates, we interpreted this information in terms of the cosine of the obliquity:  . Figure 8 shows the cumulative distribution of cosγ for the six small members in our experiment. Some of them show a clear tendency towards near extreme positive or negative cos γ values. For instance, 2015 TD44 and 2016 CX104 from box B have cosγ systematically negative, thus having a predicted retrograde sense of rotation and inward migration. Similarly, clones of 2014 JY105 from box A have a strong preference for positive cos γ values, thus a prograde rotation and outward migration. These predictions might be tested and verified observationally, when good enough photometric observations of these small asteroids are obtained.
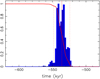 |
Fig. 7 Number of convergent solutions at the ΔV′≤ 6 m s−1 limit from the backward integration of six small members with Yarkovsky clones and the nominal orbit of (525) Adelaide. The blue histogram provides differential distribution using 2 kyr bins (maximum normalised to unity); the red curve is the respective cumulative distribution. The thin vertical red line shows the median epoch of the cumulative distribution, the vertical dashed lines are 5 and 95% limits. The time is at the abscissa to the past. |
3 Discussion
The Adelaide and Datura families are very similar in many respects: (i) they share nearly identical locations in the space of proper orbital elements, (ii) they have overlapping ages, and (iii) their scales of events are nearly the same (both were massive cratering events on a 10 km parent body). Here we examine their origin from two different perspectives: either two independent events or causally linked events.
Adelaide and Datura formations from a background population of impactors
Before we discuss the more speculative case of a possible relation between the Adelaide and Datura families, we find it important to analyse the probability of their formation by an impact of a projectile from the background population of asteroids in the main belt. This is the standard view and comparison situation. We used a classical Öpik-Wetherill approach to estimate the collision probability of two Keplerian orbits whose secular angles exhibit regular precession (e.g. Öpik 1951; Wetherill 1967; Greenberg 1982). Applying this formulation to the case of a collision between Datura and Adelaide versus the main belt population, we obtained an intrinsic collisional probability Pi ≃ 2.9 × 10⁻¹⁸ km−2 yr−1 and a mean impact velocity of vimp ≃ 5.2 km s−1 (see also Bottke et al. 2015, 2020). Taking into consideration that both (525) Adelaide and (1270) Datura are approximately 10 km in size (e.g. Vokrouhlický et al. 2009), the critical impact specific energy is  J kg−1 (e.g. Bottke et al. 2015, 2020). Together with the vimp stated above, this implies that the impactors ≥580 m in size (or larger), are capable of catastrophically disrupting Adelaide- or Datura-size objects (e.g. Bottke et al. 2015). The smaller impactors produce cratering events. Since both the Adelaide and Datura families represent large cratering events, we assumed an impactor of ≃ 100 m in size, and noted there are ≃108 such asteroids in the main belt (e.g. Bottke et al. 2015, 2020). Putting together these data, we found the yearly probability of such an impact specifically on (525) Adelaide or (1270) Datura to be ≃ 7.2 × 10⁻⁹ yr−1 or one such impact every ≃140 Myr. However, there is nothing special about (525) Adelaide or (1270) Datura, as they are only two of about ≃ 104 10 km-sized objects in the main belt (e.g. Bottke et al. 2015). Any one of them may be the seed of a Datura- or Adelaide-like family. So, we can presume that these events happen onceevery ≃14 kyr somewhere in the main belt (compare with Fig. 15 in Bottke et al. 2005). Since only ≃ 10−15% of these objects are in the inner main belt (e.g. Masiero et al. 2011), the frequency of the occurrence of the Datura- or Adelaide-like events in the inner main belt, where they can be more easily discovered, is once per ≃ 140 kyr. Given this information, the similar ages of the two families in that rank is slightly anomalous, but not shocking. What adds a little more to their anomaly is their orbital proximity, but even that might be a fluke. So, we conclude that the formation of the two families independently from background-population impactors is, in fact, possible.
Adelaide and Datura formations in causal relation
We now analyse the possibility of a causal relation between the origin of the two families. We make the assumption that, for instance, the Adelaide family formed first and the fresh stream of its numerous fragments hit Datura to form its own family (changing the role of the families in this logic chain does not influence the results too much). We again assume that a fragment of ≃ 100 m in size serves as the impactor for the Datura family. The orbital proximity of the two families implies an HCM distance of only ≃ 730 m s−1, implying that a larger Adelaide fragment would perhaps be needed to produce an effect similar to that considered above for background impactors hitting at much higher velocity. This would actually only strengthen our conclusions. In order to estimate the total number of such fragments in the Adelaide family we consulted the currently observed population in Fig. 4. Starting from the second largest fragment of ≃ 700 m in size, the cumulative size distribution is quite steep with a power-law exponent of α ≃ −(8−9). This trend, however, cannot extend too far because the total mass of this fragment population would soon exceedthat of Adelaide. Hence, at some size the distribution must get shallower. We thus used a two-slope power-law approximation of the cumulative size distribution of the Adelaide fragments between 100 and 700 m, with a very steep gradient at large sizes down to a breakpoint of Db, and a shallower part with a power exponent of β ≥−3 below this threshold. Playing with Db ≃ 400−500 m and β, we found a number of possible combinations that provide a total mass of D ≥ 100 m fragments corresponding to an effective body of ≃2 km and a cross-section corresponding to an effective body of ≤10 km. The total number of D ≥ 100 m fragments remained less than ≃(2000−2500).
Because of the extreme proximity of the Datura and Adelaide families, the relative orbital architecture changes very slowly. This is, for instance, expressed in the difference of proper nodal and perihelion frequencies s and g, We find that δs ≃ 3.4 × 10⁻²′′ yr−1 and δg is only about an order of magnitude greater. The secular difference in proper longitude of node accumulates to ≃ 5° in 500 kyr and about ten times more in proper longitude of perihelion. In spite of the forced contributions in both quantities with an amplitude of ≃ 30°−40°, the difference inthe osculating node and perihelion of Datura and Adelaide accumulate on a million-year timescale to only a few tens of degrees. The plain use of the traditional Öpik-Wetherill collision-probability estimate is therefore meaningless for our task. Instead, we use a more straightforward approach. We numerically integrated the nominal orbits of (525) Adelaide and (1270) Datura backwards in time to the 600 kyr epoch. The integration timestep was intentionally chosen to be very short, 0.1 day. At every timestep, we converted the state-vectors of both orbits to osculating Keplerian orbits and computed their minimum orbit intersection distance (MOID). To complete this task efficiently, we used the algorithm presented in Gronchi (2005), including a Fortran code kindly provided by the author. If the computed MOID was less than 10−4 au, we outputted the result to a file; otherwise, we used a lower output rate of 40 days. We considered the results from this numerical test sufficient, at least for our purposes and even for other possible orbits of fragments related to the Adelaide family.
Figure 9 shows our results. The panels from top to bottom provide information with an increasing level of resolution, with the middle and bottom panels focusing on periods of the minima of MOID. All the zoomed panels correspond to epochs immediately following the nominal formation age of the Adelaide family; however, the nature of the results repeats during later MOID minima. These events occur with a periodicity of about 9 kyr, reflecting the intricate nature of the short- and long-period variations of osculating orbital elements of both orbits. Following the procedure of a zoom on particular case, we noted a complicated nature of MOID oscillations. We estimated how much time during each of these periods of MOID minimum the two orbits spent at the state of MOID ≤ 10 km. This was the estimated effective cross-section of all Adelaide fragments larger than 100 m supposedly capable of forming the Datura family. This number is about 1 day during these periods, which amounts to little more than 10 days in 100 kyr after the Adelaide family formation. The orbital periods of both (525) Adelaide and (1270) Datura are approximately 1220 days. Assuming the fragments are perfectly dispersed around Adelaide’s orbit, largely maximising thus the probability of our estimation, we still need be satisfied that Datura is located along its orbit right in the 10-day window interval (cumulatively). This probability is only about 10∕1220 ≃ 8.2 × 10⁻³. So, even when overestimating the chances, we found that there is only a little less than a 1% chance that the Datura family formed as a consequence of the causal chain from Adelaide’s fragments within ≃ 100 kyr after the Adelaide family formed. This is in contrast with the basic certainty that a family such as the Datura family formed within this interval of time simply because of an impact from the background population of 100 m-sized impactors.
 |
Fig. 8 Cumulative distribution of the cosine of obliquity cosγ from the converging clones of six small Adelaide members in our experiment. The asteroids in box B (2015 TD44, 2016 CX104 and 2016 GO11) are in the left panel; the asteroids in box A ((452 322) 2000 GG121, 2014 JY105 and 2015 RM186) are in the right panel. The dominantly negative values of cos γ (e.g. 2015 TD44 or 2016 CX104) imply a retrograde rotation and migration towards the Sun, while the opposite tendency (e.g. 2014 JY105) implies a prograde rotation and migration away from the Sun. |
4 Conclusions
The Adelaide family belongs to a still rare class of very young asteroid families (aged ≤ 1 Myr). It is only the third of this type whose population counts more than a few tens of members (together with Datura and Schulhof families). This makes it an interesting target of analysis. As of February 2021 we have found 51 members in the Adelaide family sorted into two groups according to their size: the largest fragment (525) Adelaide (about 10 km in size), and the remaining set of 50 sub-kilometre-sized members (the second largest fragment having an estimated size of about 700 m). The Adelaide family is thus a classical example of a huge cratering event. The perturbative effect of distant encounters with Mars represents a global dynamical feature in the location of the Adelaide family. A small strip of the family is also affected by weak three-body mean-motion resonances. Avoiding the obviously chaotic regions, we performed a backward orbital integration of selected Adelaide members to determine their age by the convergence of their longitude of node. We found the family to be 536 ± 12 kyr old.
The multitude of similarities between the Datura and Adelaide families prompted us to speculate about their related origin. Our analysis, however, tends to reject this hypothesis. We find the likelihood of this scenario to be very small. In contrast, the formation ofAdelaide- or Datura-scale families by the impact of the background population of asteroids is very likely on a ≃ 100 kyr timescale. So, it is only by a slight coincidence, though perfectly possible, that their ages are close to each other. The proximity in the space of proper elements only adds slightly to their anomaly. The take-away message from our examination of the Adelaide–Datura relation in their formation is as follows: It is nearly impossible to beat the vast background of main belt impactors for small-scale events such as witnessed by the Adelaide and Datura families. Perhaps only the largest-scalefamily forming events, such as Eos or Themis, could meaningfully influence the main belt in such a way.
 |
Fig. 9 Minimum orbital intersection distance (MOID) for the nominal orbits of (525) Adelaide and (1270) Datura, numerically propagated backwards in time (at the abscissa of all panels). Top panel: general behaviour of MOID from 450 to 550 kyr ago. Zoom-ins on the periods shown in the grey rectangles (labelled a to c) near the minima of MOID are shown in the three middle panels, and provide the information at a greater time resolution. The same is repeated in the grey rectangles (labelled aa to cc) in the middle panels, and shown at still greater resolution in the bottom panels. The time in the middle and bottom panels is in years and in the top panel in kyr. The horizontal dashed line in all the panels shows the MOID = 10 km threshold. |
Acknowledgements
We are grateful to the anonymous referee, whose numerous suggestions helped to improve the original version of this paper. This research was supported by the Czech Science Foundation (grant 18-06083S). BN acknowledges the support of the Ministry of Education, Science and Technological Development of the Republic of Serbia, contract No. 451-03-68/2020-14/200104.
Appendix A Adelaide family: membership, proper elements, and proper frequencies
As has already been mentioned in the main text, the proper orbital elements of asteroids are provided by the AstDyS web service, and more recently also by the Asteroid Families Portal6 (AFP; Radović et al. 2017). Both sets of these elements are computed using the same synthetic approach developed by Knežević & Milani (2000) and Knežević & Milani (2003). The only difference consists in the dynamical model and integration timespan. While the elements at the AFP are computed in a homogeneous manner (i.e. using the same dynamical model and integration time-span across the whole asteroid belt), the elements provided by AstDyS are obtained using specific set-ups for each region of the belt. Despite the availability of these two sets, there are, however, two main reasons why we needed to compute new proper elements here: (i) none of the introduced databases currently provides information about all the potential Adelaide family members, and (ii) the elements are not obtained using exactly the same procedure for all asteroids (in the case of AstDyS) or the procedure is not well suited for young families (in the case of AFP).
Therefore, our main goal here is to produce a homogeneous set of proper elements for all Adelaide family members, from a suitably short integration time span. This set of elements is more appropriate to study the structure of young families. Otherwise, the general outline of the computation of the synthetic proper elements that we applied hereis basically the same as discussed in Knežević & Milani (2003), where interested readers can find more details. We only briefly outline the main steps and the particular choice of the parameters. To build on the expertise of the Pisa group, the proper element computation was performed using the ORBIT9 integrator7, which employs a symplectic single-step method (implicit Runge–Kutta–Gauss) as a starter and a multi-step predictor for the propagation part of the code (see Milani & Nobili 1988).
The first step consists of a numerical propagation of the nominal orbits of all family members for 2 Myr using the dynamical model that takes into account the gravitational perturbations of seven major planets (from Venus to Neptune). The effect of Mercury is taken into account indirectly by applying a barycentric correction to the initial conditions. The integration includes an online digital-filtering procedure, which helps to remove short-period oscillations (up to about 300 yr). The code thus provides a time series for the mean orbital elements for each of the propagated asteroids. In the second step the Fourier analysis methods are used to remove the forced planetary terms and long-period perturbations from the mean elements, a procedure that eventually leads to the synthetic proper elements. In order to determine the proper frequencies of nodal and perihelion longitudes, it is necessary to perform a linear fit of the corresponding angular variables. To this end, the time series of the mean angular elements are transformed into real continuous functions simply by adding 2π times the number of complete cycles. The output obtained in this way has the same long-term slope as the original data.
The corresponding formal uncertainties are estimated along with the proper elements using running box tests. In practice this means segmenting the integrated time interval into smaller parts, each extending 1 Myr and shifted by 0.1 Myr (having thus 11 such realisations). Using the method outlined above, we compute proper elements for each of these sub-intervals. Their standard deviation with respect to the proper element values computed from the whole 2 Myr interval provides the formal uncertainty. While effective and easy to introduce, this approach has its caveats since it does not account for all the possible sources of error. As a result, the realistic uncertainty of the proper elements could be somewhat larger. For instance, we recall that the effect of Mercury is only taken into account indirectly, by applying a barycentric correction to the initial conditions. However, based on the results for the ten numbered asteroids in the Adelaide family, we verified by running a limited set of simulations with Mercury included directly that the effect of excluding Mercury from the base model is generally less than the formal uncertainties on the proper elements. We also tested the role of the perturbations of the massive bodies in the main belt, particularly dwarf planet Ceres and Vesta, and found a slightly greater impact than that of Mercury. Especially encounters to Vesta, which is located in the same orbital zone as the Adelaide family, produced noticeable effects. Luckily, the associated uncertainty on the proper elements remains at the level of their formal uncertainty. Including Ceres and Vesta into our backward integrations, testing their convergence of secular angles (see Sect. 2.4), however, exceeds the computational labour of this work and may need to be checked in the future.
Another source of errors, not taken into account so far, is due to the uncertainty on the initial data in our numerical integrations (which use just the nominal, best-fit realisation). While this source of error is typically negligible, in the case of some poorly determined orbits it could become important. To get an estimate of how important these uncertainties are, we used 2017 AU38 as a test case. This asteroid is a suitable example because its osculating orbit has a relatively large uncertainty (this case is nearly identical to 2015 TD44 mentioned in Sect. 2.4). Based on statistics derived from its orbit determination, we generated 100 clones of its initial orbit and computed proper elements for all of them. The correspondingly derived, standard deviations of the proper elements from this sample are as follows: δaP ≃ 1.3 × 10⁻⁵ au, δeP≃ 9.5 × 10⁻⁵, δ sin IP ≃ 5.9 × 10⁻⁵, δg ≃ 2 × 10⁻³′′ yr−1, and δs ≃ 3.6 × 10⁻³′′ yr−1. Comparing these values with the formal uncertainties of the proper elements for asteroid 2017 AU38 listed in Table A.1, we found that the two sets of errors are comparable only for semi-major axis, while other element errors caused by the uncertainty in the osculating orbit determination were typically an order of magnitude smaller. Therefore, these sources of errors could be neglected, except for the extreme cases of the single-opposition orbits of 2016 UO110, 2017 RS100, 2019 TC62, and 2019 YE29.
Our results are summarised in Tables A.1 and A.2, where data for the Adelaide family members are given. We also determined the proper orbital elements of candidate asteroid (159941) 2005 WV178, excluded from the family as an interloper in Sect. 2.2. We found aP = 2.249259 ± 0.000003 au, eP = 0.14545 ± 0.00107, and sin IP = 0.11716 ± 0.00053. These values are significantly different from those of the family members in Table A.1 and confirm that (159941) 2005 WV178 is unrelated to the Adelaide family. For instance, its formal HCM velocity distance from (525) Adelaide is ≃ 100 m s−1, far exceeding the estimated escape velocity from (525) Adelaide (Sect. 2.1).
Proper orbital elements (and their formal uncertainties) of the Adelaide family members.
Proper frequencies of longitude of node and perihelion (and their formal uncertainties) of the Adelaide family members.
References
- Bendjoya, P., & Zappalà, V. 2002, in Asteroids III, eds. W. F. Bottke, A. Cellino, P. Paolicchi, & R. P. Binzel (Tucson: University of Arizona Press), 613 [Google Scholar]
- Bottke, W. F., Durda, D. D., Nesvorný, D., et al. 2005, Icarus, 179, 63 [Google Scholar]
- Bottke, W. F., Vokrouhlický, D., Rubincam, D. P., & Nesvorný, D. 2006, Ann. Rev. Earth Planet. Sci., 34, 157 [Google Scholar]
- Bottke, W. F., Brož, M., O’Brien, D. P., et al. 2015, in Asteroids IV, eds. P. Michel, F. E. DeMeo, & W. F. Bottke (Tucson: University of Arizona Press), 701 [Google Scholar]
- Bottke, W. F., Vokrouhlický, D., Ballouz, R. L., et al. 2020, AJ, 160, 14 [Google Scholar]
- Farley, K. A., Vokrouhlický, D., Bottke, W. F., & Nesvorný, D. 2006, Nature, 439, 295 [NASA ADS] [CrossRef] [Google Scholar]
- Gallardo, T. 2006, Icarus, 184, 29 [Google Scholar]
- Gallardo, T. 2014, Icarus, 231, 273 [NASA ADS] [CrossRef] [Google Scholar]
- Greenberg, R. 1982, AJ, 87, 184 [NASA ADS] [CrossRef] [Google Scholar]
- Gronchi, G. F. 2005, Celest. Mech. Dyn. Astron., 93, 295 [NASA ADS] [CrossRef] [Google Scholar]
- Hendler, N. P., & Malhotra, R. 2020, Planet. Sci. J., 1, 75 [Google Scholar]
- Knežević, Z., & Milani, A. 2000, Celest. Mech. Dyn. Astron., 78, 17 [NASA ADS] [CrossRef] [Google Scholar]
- Knežević, Z., & Milani, A. 2003, A&A, 403, 1165 [NASA ADS] [CrossRef] [EDP Sciences] [Google Scholar]
- Knežević, Z., Lemaître, A., & Milani, A. 2002, in Asteroids III, eds. W. F. Bottke, A. Cellino, P. Paolicchi, & R. P. Binzel (Tucson: University of Arizona Press), 603 [Google Scholar]
- Masiero, J. R., Mainzer, A. K., Grav, T., et al. 2011, ApJ, 741, 68 [NASA ADS] [CrossRef] [Google Scholar]
- Masiero, J. R., Grav, T., Mainzer, A. K., et al. 2014, ApJ, 791, 121 [NASA ADS] [CrossRef] [Google Scholar]
- Masiero, J. R., DeMeo, F. E., Kasuga, T., & Parker, A. H. 2015, in Asteroids IV, eds. P. Michel, F. E. DeMeo, & W. F. Bottke (Tucson: University of Arizona Press), 323 [Google Scholar]
- Milani, A., & Nobili, A. M. 1988, Celest. Mech., 43, 1 [Google Scholar]
- Morbidelli, A., & Nesvorný, D. 1999, Icarus, 139, 295 [NASA ADS] [CrossRef] [Google Scholar]
- Murray, N., Holman, M., & Potter, M. 1998, AJ, 116, 2583 [NASA ADS] [CrossRef] [Google Scholar]
- Nesvorný, D., & Morbidelli, A. 1998a, Celest. Mech. Dyn. Astron., 71, 243 [NASA ADS] [CrossRef] [Google Scholar]
- Nesvorný, D., & Morbidelli, A. 1998b, AJ, 116, 3029 [NASA ADS] [CrossRef] [Google Scholar]
- Nesvorný, D., & Vokrouhlický, D. 2006, AJ, 132, 1950 [NASA ADS] [CrossRef] [Google Scholar]
- Nesvorný, D., Bottke, W. F., Dones, L., & Levison, H. F. 2002, Nature, 417, 720 [NASA ADS] [CrossRef] [Google Scholar]
- Nesvorný, D., Vokrouhlický, D., & Bottke, W. F. 2006, Science, 312, 1490 [NASA ADS] [CrossRef] [Google Scholar]
- Nesvorný, D., Brož, M., & Carruba, V. 2015, in Asteroids IV, eds. P. Michel, F. E. DeMeo, & W. F. Bottke (Tucson: University of Arizona Press), 297 [Google Scholar]
- Novaković, B., & Radović, V. 2019, Res. Notes Am. Astron. Soc., 3, 105 [Google Scholar]
- Öpik, E. J. 1951, Proc. R. Irish Acad. Sect. A, 54, 165 [Google Scholar]
- Parker, A., Ivezić, Ž., Jurić, M., et al. 2008, Icarus, 198, 138 [NASA ADS] [CrossRef] [Google Scholar]
- Pilcher, F. 2014, Minor Planet Bull., 41, 155 [Google Scholar]
- Pravec, P., Harris, A. W., Kušnirák, P., Galád, A., & Hornoch, K. 2012, Icarus, 221, 365 [Google Scholar]
- Pravec, P., Fatka, P., Vokrouhlický, D., et al. 2018, Icarus, 304, 110 [NASA ADS] [CrossRef] [Google Scholar]
- Radović, V., Novaković, B., Carruba, V., & Marčeta, D. 2017, MNRAS, 470, 576 [NASA ADS] [CrossRef] [Google Scholar]
- Rosaev, A., & Plávalová, E. 2018, Icarus, 304, 135 [Google Scholar]
- Rożek, A., Breiter, S., & Jopek, T. J. 2011, MNRAS, 412, 987 [NASA ADS] [Google Scholar]
- Scheeres, D. J., Britt, D., Carry, B., & Holsapple, K. A. 2015, in Asteroids IV, eds. P. Michel, F. E. DeMeo, & W. F. Bottke (Tucson: University of Arizona Press), 745 [Google Scholar]
- Ševeček, P., Brož, M., Nesvorný, D., et al. 2017, Icarus, 296, 239 [NASA ADS] [CrossRef] [Google Scholar]
- Vokrouhlický, D., & Nesvorný, D. 2011, AJ, 142, 26 [NASA ADS] [CrossRef] [Google Scholar]
- Vokrouhlický, D., Milani, A., & Chesley, S. R. 2000, Icarus, 148, 118 [NASA ADS] [CrossRef] [Google Scholar]
- Vokrouhlický, D., Ďurech, J., Michałowski, T., et al. 2009, A&A, 507, 495 [NASA ADS] [CrossRef] [EDP Sciences] [Google Scholar]
- Vokrouhlický, D., Bottke, W. F., Chesley, S. R., Scheeres, D. J., & Statler, T. S. 2015, in Asteroids IV, eds. P. Michel, F. E. DeMeo, & W. F. Bottke (Tucson: University of Arizona Press), 509 [Google Scholar]
- Vokrouhlický, D., Ďurech, J., Pravec, P., et al. 2016, AJ, 151, 56 [NASA ADS] [CrossRef] [Google Scholar]
- Vokrouhlický, D., Pravec, P., Ďurech, J., et al. 2017a, A&A, 598, A91 [NASA ADS] [CrossRef] [EDP Sciences] [Google Scholar]
- Vokrouhlický, D., Bottke, W. F., & Nesvorný, D. 2017b, AJ, 153, 172 [NASA ADS] [CrossRef] [Google Scholar]
- Wetherill, G. W. 1967, J. Geophys. Res., 72, 2429 [NASA ADS] [CrossRef] [Google Scholar]
- Wisdom, J., & Holman, M. 1991, AJ, 102, 1528 [NASA ADS] [CrossRef] [Google Scholar]
The exact quantitative solution for the family’s age determination depends on what level-bar of
ΔV′ is used. Our nominal solution uses 6 m s−1, motivated by the expectation that small fragments are typically launched at the escape velocity from the parent body. Luckily, the result does not critically depend on the small variations in this criterion. For instance, setting a ΔV′ = 10 m s−1 limit, allowing thus a tail of fast-escaping fragments, would indicate a  kyr age solution. Much higher values of ΔV′ are not expected for cratering events (e.g. Ševeček et al. 2017).
All Tables
Proper orbital elements (and their formal uncertainties) of the Adelaide family members.
Proper frequencies of longitude of node and perihelion (and their formal uncertainties) of the Adelaide family members.
All Figures
|
Fig. 1 Orbital convergence of secular angles for the nominal orbits of (452 322) 2000 GG121 and (525) Adelaide: (i) difference in longitude of node δΩ = Ω452 322 − Ω525 (red line), (ii) difference in longitude of perihelion δϖ = ϖ452 322 − ϖ525 (blue line)(osculating values in both cases). The abscissa is time to the past (in kyr). At approximately 500 kyr ago, both secular angles of (452 322) 2000 GG121 converge to the respective values of (525) Adelaide. |
| In the text | |
|
Fig. 2 Orbital convergence of secular angles for the nominal orbits of 2016 GO11 and (525) Adelaide: (i) difference in longitude of node δΩ = Ω2016 GO11 − Ω525 (red line), (ii) difference in longitude of perihelion δϖ = ϖ2016 GO11 − ϖ525 (blue line)(osculating values in both cases). The abscissa is time to the past (in kyr). At approximately 500 kyr ago, both secular angles of 2016 GO11 converge to the respective values of (525) Adelaide. |
| In the text | |
|
Fig. 3 Orbital convergence of secular angles for the nominal orbits of (475 474) 2006 SZ152 and (525) Adelaide: (i) difference in longitude of node δΩ = Ω475 474 − Ω525 (red line), (ii) difference in longitude of perihelion δϖ = ϖ475 474 − ϖ525 (blue line) (osculating values in both cases). The abscissa is time to the past (in kyr). The secular angle differences stay very small for the past ≃ 600 kyr (within about one degree), but the precise nature of the convergence is not as good as in the previous two figures because of the likely contribution of the Yarkovsky acceleration in the orbital evolution of the smaller asteroid (475 474) 2006 SZ152 (see text). |
| In the text | |
|
Fig. 4 Cumulative distribution N(< H) of absolute magnitude H for known Adelaide family members. The diamond symbol denotes the largest fragment (525) Adelaide, filled circles are smaller fragments in the family. The grey line shows the power-law relation N(< H) ∝ 10γH for γ = 1.8, which approximates the distribution of small members. The upper abscissa provides an estimate of size, assuming geometric albedo pV = 0.22 (a possiblevalue for (525) Adelaide; Sect. 2.1). The sizes would be slightly smaller for larger pV values. |
| In the text | |
|
Fig. 5 Adelaide family represented by two possible plane-projections of proper orbital elements: (i) semi-major axis aP vs. sine of inclination sinIP (top panel), and (ii) semi-major axis aP vs. eccentricity eP (bottom panel). Shown are the largest fragment (525) Adelaide (diamond) and the smaller family members (black filled circles for multi-opposition orbits, grey for single-opposition orbits). The vertical and horizontal bars are the formal uncertainty values of the proper elements from Table A.1. The vertical grey stripes indicate the locations of several weak mean motion resonances (from left to right): 14J+9S-5, 8J+2E-9, and 15J-11S-3; the width of the line approximates resonances strength at the value of proper eccentricity using Gallardo (2014). Boxes A and B contain asteroids whose orbits are well separated from (525) Adelaide, suitable for dating family origin using backward integrations (see Sect. 2.4). The grey arrow in the top panel gives an estimate of maximum drift in semi-major axis of a ≃ 0.5 km asteroid, typical of many small members in the family (Fig. 4), in 500 kyr. The grey dashed ellipses indicate proper element zones in which fragments may land if ejected from (525) Adelaide with 6 m s−1 velocity (assuming true anomaly f = 90° and argument of perihelion such that ω + f = 0° at origin). |
| In the text | |
|
Fig. 6 Top panel: osculating perihelion distance of (525) Adelaide’s nominal orbit (black) and the osculating aphelion distance of Mars (grey) vs. time into the past. Adelaide’s orbital behaviour is representative, at this level, of all members in the family. The arrows indicate epochs of local minima of Adelaide’s perihelion distance if ≤ 1.8 au during the past 700 kyr. Bottom panel: mean semi-major axis ā of six selected members of the Adelaide family: (452 322) 2000 GG121 in red; (475 474) 2006 SZ152 in green; (504 375) 2007 VV73 in blue; (517 580) 2014 UZ170 in cyan; (534 611) 2014 UC204 in magenta; and (545 614) 2011 SA45 in yellow. The mean value of the semi-major axis was obtained from the osculating value by digitally filtering short-period terms (periods ≤ 300 yr). The distinct jumps in ā correlate with the minima at the perihelion distance (therefore maxima of the orbital eccentricity), suggesting that shallow Mars encounters along with resonant perturbations are the responsible mechanism. |
| In the text | |
|
Fig. 7 Number of convergent solutions at the ΔV′≤ 6 m s−1 limit from the backward integration of six small members with Yarkovsky clones and the nominal orbit of (525) Adelaide. The blue histogram provides differential distribution using 2 kyr bins (maximum normalised to unity); the red curve is the respective cumulative distribution. The thin vertical red line shows the median epoch of the cumulative distribution, the vertical dashed lines are 5 and 95% limits. The time is at the abscissa to the past. |
| In the text | |
|
Fig. 8 Cumulative distribution of the cosine of obliquity cosγ from the converging clones of six small Adelaide members in our experiment. The asteroids in box B (2015 TD44, 2016 CX104 and 2016 GO11) are in the left panel; the asteroids in box A ((452 322) 2000 GG121, 2014 JY105 and 2015 RM186) are in the right panel. The dominantly negative values of cos γ (e.g. 2015 TD44 or 2016 CX104) imply a retrograde rotation and migration towards the Sun, while the opposite tendency (e.g. 2014 JY105) implies a prograde rotation and migration away from the Sun. |
| In the text | |
|
Fig. 9 Minimum orbital intersection distance (MOID) for the nominal orbits of (525) Adelaide and (1270) Datura, numerically propagated backwards in time (at the abscissa of all panels). Top panel: general behaviour of MOID from 450 to 550 kyr ago. Zoom-ins on the periods shown in the grey rectangles (labelled a to c) near the minima of MOID are shown in the three middle panels, and provide the information at a greater time resolution. The same is repeated in the grey rectangles (labelled aa to cc) in the middle panels, and shown at still greater resolution in the bottom panels. The time in the middle and bottom panels is in years and in the top panel in kyr. The horizontal dashed line in all the panels shows the MOID = 10 km threshold. |
| In the text | |
Current usage metrics show cumulative count of Article Views (full-text article views including HTML views, PDF and ePub downloads, according to the available data) and Abstracts Views on Vision4Press platform.
Data correspond to usage on the plateform after 2015. The current usage metrics is available 48-96 hours after online publication and is updated daily on week days.
Initial download of the metrics may take a while.