| Issue |
A&A
Volume 656, December 2021
|
|
|---|---|---|
| Article Number | A94 | |
| Number of page(s) | 20 | |
| Section | Stellar structure and evolution | |
| DOI | https://doi.org/10.1051/0004-6361/202140881 | |
| Published online | 08 December 2021 | |
Metallicity-dependent nucleosynthetic yields of Type Ia supernovae originating from double detonations of sub-MCh white dwarfs⋆
1
Zentrum für Astronomie der Universität Heidelberg, Astronomisches Rechen-Institut, Mönchhofstr. 12-14, 69120 Heidelberg, Germany
e-mail: [email protected]
2
Heidelberger Institut für Theoretische Studien, Schloss-Wolfsbrunnenweg 35, 69118 Heidelberg, Germany
3
Konkoly Observatory, Research Centre for Astronomy and Earth Sciences, Eötvös Loránd Research Network (ELKH), Konkoly Thege Miklós út 15-17, 1121 Budapest, Hungary
4
ELTE Eötvös Loránd University, Institute of Physics, Pázmány Péter Sétány 1/A, Budapest 1117, Hungary
5
Joint Institute for Nuclear Astrophysics - Center for the Evolution of the Elements, USA
6
School of Science, University of New South Wales, Canberra, ACT 2600, Australia
7
Astrophysics Research Center, School of Mathematics and Physics, Queen’s University Belfast, Belfast, BT7 1NN Northern Ireland, UK
8
GSI Helmholtzzentrum für Schwerionenforschung, Planckstraße 1, 64291 Darmstadt, Germany
9
Zentrum für Astronomie der Universität Heidelberg, Institut für theoretische Astrophysik, Philosophenweg 12, 69120 Heidelberg, Germany
Received:
25
March
2021
Accepted:
23
August
2021
Double detonations in sub-Chandrasekhar mass carbon-oxygen white dwarfs (WD) with helium shells ares potential explosion mechanisms for Type Ia supernovae. The mechanism consists of a shell detonation and subsequent core detonation. The focus of our study is the effect of the progenitor metallicity on the nucleosynthetic yields. For this, we computed and analyzed a set of 11 different models with varying core and shell masses at four different metallicities each. This results in a total of 44 models at metallicities between 0.01 Z⊙ and 3 Z⊙. Our models show a strong impact of the metallicity in the high-density regime. The presence of 22Ne causes a neutron-excess that shifts the production from 56Ni to stable isotopes such as 54Fe and 58Ni in the α-rich freeze-out regime. The isotopes of the metallicity implementation further serve as seed nuclei for additional reactions in the shell detonation. The production of 55Mn increases with metallicity, confirming the results of previous work. A comparison of elemental ratios relative to iron shows a good match to solar values for some models. Super-solar values are reached for Mn at 3 Z⊙ and solar values in some models at Z⊙. This indicates that the required contribution of Type Ia supernovae originating from Chandrasekhar-mass WDs can be lower than estimated in previous work to reach solar values of [Mn/Fe] at [Fe/H] = 0. Our galactic chemical evolution models suggest that Type Ia supernovae from sub-Chandrasekhar mass white dwarfs, along with core-collapse supernovae, could account for more than 80% of the solar Mn abundance. Using metallicity-dependent Type Ia supernova yields helps to reproduce the upward trend of [Mn/Fe] as a function of metallicity for the solar neighborhood. These chemical evolution predictions, however, depend on the massive star yields adopted in the calculations.
Key words: methods: numerical / nuclear reactions, nucleosynthesis, abundances / stars: abundances / supernovae: general / white dwarfs
Tables A.1–A.22 are only available at the CDS via anonymous ftp to cdsarc.u-strasbg.fr (130.79.128.5) or via http://cdsarc.u-strasbg.fr/viz-bin/cat/J/A+A/656/A94
© ESO 2021
1. Introduction
The nucleosynthetic yields from thermonuclear explosions of carbon-oxygen white dwarfs (CO WDs) depend sensitively on the WD mass and explosion mechanism. Studies of these parameters were carried out by Iwamoto et al. (1999), Brachwitz et al. (2000), Leung & Nomoto (2018, 2020), Bravo et al. (2019), Bravo (2019), Lach et al. (2020), and Gronow et al. (2021) among others. Here we focus on an additional parameter, namely the metallicity of the WD, which originates from the metallicity of the zero age main sequence progenitor star and leads to a neutron excess in the WD material. An enhancement of neutrons can be achieved in different ways depending on the total mass of the WD. In Chandrasekhar mass (MCh) WDs it originates from the initial metallicity and, more importantly, from electron capture in high-density regions. This second effect is not found in sub-MCh WDs as high enough densities are not reached. Instead, the metallicity leads to an initial neutron-excess still present when entering the α-rich freeze-out regime. The decrease in the electron fraction Ye increases the production of neutron-rich iron group elements (IGEs) (Thielemann et al. 1986).
Nuclear statistical equilibrium (NSE) is not reached in the He detonation of a sub-MCh CO WD with a He shell, and heavy elements are produced via α-captures. In this density regime the nucleosynthetic yields are affected by the available seed nuclei of the metallicity implementation (Hashimoto et al. 1983; Khokhlov & Érgma 1985; Lach et al. 2020). A neutron-excess is present due to the metallicity and supports the formation of neutron-rich isotopes.
A metallicity dependence of the nucleosynthetic yields is expected from observations. Höflich et al. (1998) find that small changes in the spectra can be attributed to the metallicity of the WD. They also find that the effect on the color is stronger and depends on redshift. This occurs because the spectrum is transferred to different color bands at varying redshifts. Other effects were investigated by Umeda et al. (1999) and Iwamoto et al. (1999), who find that a change in metallicity (and therefore a change in Ye) influences the amount of 54Fe, 56Ni, and 58Ni produced in the explosion. Furthermore, Timmes et al. (2003) attribute some variations found in observations of peak luminosities to different metallicities of the exploding WD. This is in agreement with work by Mazzali & Podsiadlowski (2006) and Bravo et al. (2010). Mazzali & Podsiadlowski (2006) investigate the (54Fe + 58Ni) / 56Ni ratio as a source of the scatter in the light curves, and find that their bolometric light curves are fainter with higher ratios (differences of 0.25 mag). Their values for the luminosity decrease over 15 days after peak, Δm15, compare well with observations. In addition, Timmes et al. (2003) derive a linear relation between the metallicity and 56Ni mass produced in the explosion. It is apparent in their models of MCh WDs at 1/3 Z⊙ to 3 Z⊙ that the amount of 56Ni produced decreases by 25% going to higher metallicity. A determination of the metallicity from SN observations is attempted by Lentz et al. (2000) and Taubenberger et al. (2008), though they are affected by large uncertainties originating from the imprecision of the observations themselves as well as potential degeneracies between metallicity and other effects on the spectra.
Type Ia supernovae play a key role in galactic chemical evolution (GCE) (e.g., Greggio & Renzini 1983; Matteucci & Greggio 1986; Kobayashi et al. 1998; Lach et al. 2020). The nucleosynthetic yields found in explosion simulations are crucial input parameters for GCE models. Comparing GCE predictions with the composition of the Milky Way and other galaxies helps to constrain the explosion mechanism and identify the importance of various proposed SN Ia progenitors. Previous GCE studies suggested that multiple SN Ia channels should have contributed to the synthesis of Mn (e.g., Seitenzahl et al. 2013a; Cescutti & Kobayashi 2017), including a possible ∼25 − 75% contribution from sub-MCh explosions in the solar neighborhood (e.g., Seitenzahl et al. 2013a; Kobayashi et al. 2020; Eitner et al. 2020). Additional GCE studies suggested that chemical evolution trends derived from spectroscopy are better reproduced with models that include metallicity-dependent SN Ia yields (e.g., Kobayashi et al. 1998; Cescutti et al. 2008; North et al. 2012). Work by de los Reyes et al. (2020) based on their comparison of data from dwarf spheroidal galaxies with extended star formation history to theoretical models suggests that the dominant progenitors are sub-MCh WDs at early times shifting to MCh WDs at later times.
We investigate the dependence of the nucleosynthetic yields of thermonuclear explosions of sub-MCh CO WDs with He shells on the metallicity of the progenitor star as a follow-up study to the work presented in Gronow et al. (2021). The simulations of Gronow et al. (2021) follow a double detonation of the WD. In this scenario a He detonation is ignited at the base of the shell due to thermal instabilities. It causes a second core detonation when the shock wave converges off-center in the core (converging shock mechanism) or when the He detonation wave converges at the antipode to its ignition spot (scissors mechanism). In a third scenario a carbon detonation is ignited at the core–shell interface directly after He ignition (edge-lit mechanism). Gronow et al. (2021) compute a set of models exploring different core and He shell masses at solar metallicity. On the basis of these models three more metallicity values of the WD are examined in this work spanning the range from 0.01 Z⊙ to 3 Z⊙. This work is one of the first to cover the parameter space for sub-MCh CO WDs with He shell (see also Leung & Nomoto 2020). Other work (e.g., Sim et al. 2010; Shen et al. 2018) investigates pure detonations of sub-MCh CO WDs.
The methods and model setup are described in Sect. 2. The results of the nucleosynthesis calculations are presented in Sect. 3 including a comparison of elemental ratios relative to iron to solar values. In Sect. 4 the results are compared to previous works. We discuss the implication of our SN Ia yields in a GCE context in Sect. 5. Conclusions are drawn in Sect. 6.
2. Methods and model setup
In our hydrodynamic simulations of explosions of CO WDs with He shells, the metallicity is represented by 14N and 22Ne. During the evolution of the WD progenitor star and its companion 14N is formed in hydrogen burning via the CNO cycle from pre-existing C, N, and O at zero age main sequence. In subsequent He burning of the WD progenitor, it is converted to 22Ne via 14N(α,γ)18F(β+, νe)18O(α,γ)22Ne. There the metallicity of the progenitor star ends up as 14N in the He shell and 22Ne in the CO core. A homogeneous distribution of 22Ne is employed in the core. This is a reasonable assumption as sedimentation of 22Ne in the rather extended sub-MCh WDs is not expected to have a significant effect (see Bildsten & Hall 2001; Deloye & Bildsten 2002; García-Berro et al. 2008).
In a postprocessing step, we increased the number of species included to represent the metallicity in order to obtain detailed nucleosynthetic yields. In our simulations the isotopes coming from the implementation of the metallicity influence the final yields.
Our study is based on results of the hydrodynamics simulations of Gronow et al. (2021). Their explosion simulations were carried out with the AREPO code (Springel 2010) in 3D. Details on the method can be found in Gronow et al. (2021) and references therein. The models cover a range of different core and shell masses. The core mass of their models is between 0.8 M⊙ and 1.1 M⊙ with shell masses of 0.02 M⊙ to 0.1 M⊙.
We used the temperature and density evolution of the two million tracer particles from their explosion simulations (Gronow et al. 2021). These tracers had a random distribution in the initial WD which sampled the mass distribution of the WD and represented equal fractions of the material. They allow us to determine detailed nucleosynthetic yields and the ejecta structure of the SN Ia explosion models (Travaglio et al. 2004). The evolution of the temperature and density of tracers which were initially located in the He shell and CO core of Model M10_03_1 are shown in Fig. 1 in red and blue, respectively. Although the tracers were chosen at random, they represent the typical evolution of tracers in these regions. The peaks in the profiles clearly illustrate that the He detonation reached the tracer particle in the He shell in the first 0.4 s before the C detonation had an impact on the tracer particle in the core. Following this, the tracer particle from the He shell exhibits another rise in temperature and density as a shock wave originating from the C detonation reaches its position. Gronow et al. (2021) carried out a postprocessing step involving a large nuclear reaction network consisting of 384 isotopes. The models in their study assumed solar metallicity of the zero age main sequence progenitor star.
 |
Fig. 1. Evolution of temperature (thin lines) and density (thick lines) of a shell (blue) and core (red) tracer particle of Model M10_03_1. |
We followed up on this by re-calculating the postprocessing step using the parameters of the hydrodynamic simulations, which are listed in Tables 1 and 2 of Gronow et al. (2021), and Gronow et al. (2020) for Models M2a and M2a_pp. Our additional models assume three different metallicities, 0.01, 0.1, and 3 Z⊙. For this we scaled the solar abundances given by Asplund et al. (2009). However, according to Prantzos et al. (2018) at sub-solar metallicity we kept the abundance ratios of the α-elements fixed (i.e., [C/Fe] = 0.18, [O/Fe] = 0.47, [Mg/Fe] = 0.27, [Si/Fe] = 0.37, [S/Fe] = 0.35, [Ar/Fe] = 0.35, [Ca/Fe] = 0.33, [Ti/Fe] = 0.23), a choice motivated by observations of low-metallicity stars. Similar to Gronow et al. (2021), we used this set of elements to represent metallicity in the postprocessing step along with the initial profile of the composition. In the initial profile of the hydrodynamic simulations, the metallicity was set by including 14N and 22Ne in the shell and core, respectively (see Gronow et al. 2021). We note that some core material was mixed into the shell during the relaxation step (see Gronow et al. 2020, 2021 for a detailed description of the relaxation step) adding some 12C and 22Ne to the shell. A total of 384 species were followed in the postprocessing step. In the same way as Gronow et al. (2021) and following the methods in Pakmor et al. (2012), the REACLIB database (Rauscher & Thielemann 2000) in its 2014 version was used. Weak reaction rates were taken from Langanke & Martínez-Pinedo (2001).
Major differences between our approach and a full re-calculation of the hydrodynamics were not expected since the changes in the 14N and 22Ne abundances at the different metallicities do not alter the energy release in the hydrodynamic simulations significantly. The situation is different for deflagrations where the buoyancy, and therefore the Rayleigh-Taylor instabilities, depend on Ye. In contrast to detonations, the propagation of a deflagration front is thus affected by the metallicity (e.g., Meakin et al. 2009). The assumption we made here is confirmed by the comparison of the models presented in Table 1. Model M2a is taken from Gronow et al. (2020). The model was calculated at zero metallicity and has a total mass of 1.05 M⊙ with a He shell of 0.07 M⊙ at He ignition. Model M10_05_1, on the other hand, has a similar mass configuration, though it was calculated at solar metallicity (Model M10_05 in Gronow et al. 2021). Model M2a_pp is the same model as Model M2a, but the postprocessing step was calculated with solar metallicity instead of zero metallicity. An inspection of the abundances of Models M2a_pp and M10_05_1 at t = 100 s after He detonation ignition shows that the results of the postprocessing step with varying metallicities are in reasonably good agreement with a full re-calculation of the hydrodynamic model. The maximum difference in the yields produced in the core detonation is only 10%, while the maximum difference is 50% in the He detonation (excluding 12C in both). However, differences in the yields produced in the He detonation can in part be attributed to the slightly different setups of Model M2a (and therefore Model M2a_pp) and Model M10_05_1 at the beginning of the relaxation simulation, with the differences in the total and shell masses being less than 1% (see Gronow et al. 2021 for an explanation of the difference). Generally, the contribution of the yields from the He detonation to the total nucleosynthetic yields are small compared to those of the core detonation. Our approach is thus sufficient to derive nucleosynthetic yields for GCE studies. It saves significant computational costs as additional 3D hydrodynamical simulations of the explosion do not need to be carried out. Nevertheless, there might be slight differences visible in the observables because they are sensitive to the products of the He shell detonation (Höflich et al. 1996; Nugent et al. 1997; Kromer et al. 2010).
Final abundances for Model M2a(1), M2a_pp, and M10_05_1(2).
Final abundances for Model M10_05_001, M10_05_01, and M10_05_3.
Final abundances for Model M10_10_001, M10_10_01, M10_10_1, and M10_10_3.
Final abundances for Model M10_03_001, M10_03_01, M10_03_1, and M10_03_3.
Final abundances for Model M10_02_001, M10_02_01, M10_02_1, and M10_02_3.
Final abundances for Model M09_10_001, M09_10_01, M09_10_1, and M09_10_3.
Final abundances for Model M09_05_001, M09_05_01, M09_05_1, and M09_05_3.
Final abundances for Model M09_03_001, M09_03_01, M09_03_1, and M09_03_3.
Our models are named based on the initial core mass (first two digits), the initial shell mass (two digits), and the metallicity relative to solar. Models M08_10_r and M09_10_r of Gronow et al. (2021) are renamed to M08_10 and M09_10, respectively, for simplicity. The use of names such as M10_05 refers to all models with an initial core mass of 1.0 M⊙ and shell mass of 0.05 M⊙, therefore combining names of four models at different metallicity. The nucleosynthesis yields of the models will be uploaded to the supernova archive HESMA1 (Kromer et al. 2017).
3. Metallicity-dependent nucleosynthetic yields
In the following we discuss the effect different metallicities have on the nucleosynthetic yields. For a comparison of the models at different masses (e.g., all M10_10 and M09_05 models) as well as a discussion of the differences in the detonation ignition mechanism of the various models we refer to Gronow et al. (2021). The nucleosynthetic yields are affected by the modeling of the C detonation. The shock strength depends on its propagation history. Because C detonations cannot be spatially resolved in SN simulations, a substantial modeling effort is necessary to settle this issue, which is beyond the scope of this work. The relations of the nucleosynthetic yields of the models found by Gronow et al. (2021) are the same for the models at the other metallicities. Our analysis focuses on manganese as well as iron and nickel. These elements originate mostly from SNe Ia (Timmes et al. 1995; McWilliam 1997; Kobayashi et al. 2020) or are a main product of a SN Ia explosion.
Tables 1–12 list the nucleosynthetic yields of selected isotopes for all models at t = 100 s after He detonation ignition. They are given separately for the He detonation and core detonation. The distinction is based on the initial He mass fraction of the cell a tracer is associated with, thus cells with an initial He mass fraction larger than 0.01 are considered to be part of the shell. The abundances of the models at solar metallicity are taken from Gronow et al. (2021) with additional values given for 54Fe, 55Fe, and 58Ni. The yields of Model M2a are taken from Gronow et al. (2020) and are extended by 52Fe, 54Fe, 55Fe, 55Mn, 55Co, and 58Ni.
Detailed nucleosynthetic yields for the models at 0.01, 0.1, and 3 Z⊙ are given in Tables A.1–A.22. The yields of the solar metallicity models are included in Gronow et al. (2021). Tables A.1–A.11 list the abundances of stable nuclides, radioactive nuclides with lifetime longer than 2 Gyr at time t = 100 s, and radioactive nuclides with shorter lifetime decayed to stability. The nucleosynthetic yields of some radioactive nuclides with lifetime shorter than 2 Gyr at t = 100 s are given in Tables A.12–A.22. Each table lists the abundances for one hydrodynamic explosion model at different metallicities. The tables are available in electronic form at the CDS.
3.1. Nucleosynthesis in SNe Ia
The nucleosynthesis in SN Ia explosions can be described as a process of explosive silicon (Si) burning with carbon and oxygen serving as fuel. Woosley et al. (1973) distinguished three different burning regimes: incomplete Si burning, and α-rich freeze-out and normal freeze-out from NSE. Details of the burning regimes and their leading reactions are also discussed by Lach et al. (2020). Figure 1 in Lach et al. (2020) illustrates the burning regimes in the Tpeak − ρpeak - plane following Woosley et al. (1973) for explosive Si burning. The burning regimes are also indicated in our Figs. 2–4 by shaded boundaries.
 |
Fig. 2. Tracer particle distribution in the Tpeak − ρpeak - plane for Models M10_03 at 0.01, 0.1, 1, and 3 Z⊙; the mass fractions of 55Mn (top, a–d) and 55Co (bottom, e–h) at t = 100 s are color-coded. The shaded areas split the domain into normal freeze-out from NSE, α-rich freeze-out, and incomplete Si-burning (clockwise starting at top right) following Woosley et al. (1973) (see also Lach et al. 2020). |
 |
Fig. 3. Tracer particle distribution in the Tpeak − ρpeak - plane of the He detonation for Model M10_03_001 at t = 100 s. The 4He mass fraction is color-coded. The shaded areas are the same as in Fig. 2. |
 |
Fig. 4. Tracer particle distribution in the Tpeak − ρpeak - plane for Models M10_03_001 (left) and M10_03_3; the mass fractions of 56Ni (top) and 58Ni (bottom) at t = 100 s are color-coded with shaded areas as in Fig. 2. |
In double detonations of sub-MCh CO WDs, explosive He burning is taking place as well (Khokhlov 1984; Khokhlov & Érgma 1985). It is clear, however, by comparing Fig. 1 of Khokhlov (1984) (see also Khokhlov & Érgma 1985) to our figures that NSE is not reached in the He detonation of our models.
The generally low central density in sub-MCh CO WDs is an important parameter for the nucleosynthesis as it implies that the regime of normal freeze-out from NSE is not reached. Instead, IGEs are produced in α-rich freeze-out and incomplete Si burning in the core detonation, and in the burning of the He detonation.
3.2. Low- and intermediate-mass elements
The models show a varying impact of the metallicity on the nucleosynthetic yields produced in the He and core detonations. This is the case because its impact is different at higher densities present in the core. As described in Sect. 1, the metallicity causes a neutron-excess in the core while the isotopes of the metallicity implementation (14N and 22Ne among others) serve as seed nuclei for the reactions in the He detonation and in the low-density regime of the core (see Shen & Moore 2014, for a discussion of the effect on the detonation speed). This effect is important for the production of IMEs as they are mostly produced in the incomplete Si burning regime at maximum densities lower than about 2.5 × 10⁷ gcm−3. In the He detonation little or no influence of the metallicity is observed on the abundances of elements lighter or equal to 44Ti. This is also the case for 12C, 16O, and 28Si in the ejecta of the core detonation. The behavior is expected for the fuel of the detonation (C and O) because the detonation propagation is not affected by the metallicity, as stated above. In addition, IMEs such as 28Si are not produced in NSE. However, it is obvious from the yields produced in the core detonation that an increase in metallicity decreases the 4He abundance, which is a product in the α-rich freeze-out. With increasing neutronization the reaction 4He(αn,γ)9Be(α,n)12C commences and even becomes dominant in comparison to the triple-α reaction (Howard et al. 1993; Hix & Thielemann 1999) supporting the burning of 4He.
3.3. Manganese
55Mn is the only stable isotope of manganese. It is produced directly in incomplete Si burning and by the decay of 55Co via 55Fe. Since the abundance of 55Mn usually is orders of magnitudes below that of 55Co immediately after the explosive nuclear burning and prior to 55Co decay, the production of Mn mainly depends on the 55Co production (Truran et al. 1967). Lach et al. (2020) describe in more detail how the Mn production is influenced by different parameters in the double detonation scenario: the shell-core mass ratio, the density of the He shell, and the metallicity. The metallicity effect is discussed in the following, while Lach et al. (2020) give a detailed account of the other effects.
In the He detonation, the impact of the metallicity increase on the 55Co production is relatively weak. In contrast, the direct production of 55Mn increases by one order of magnitude for each increase in metallicity (from 0.01 Z⊙ to 0.1 Z⊙ to 1 Z⊙ to 3 Z⊙). Nevertheless, it only reaches values close to those of 55Co for Models M09_03_3 and M08_03_3. 55Fe is more abundant than 55Mn, and its dependence on metallicity is as weak as that of 55Co as both are less neutron-rich than 55Mn. The changes in the nucleosynthetic yields are a result of the presence of 14N and, in addition, 22Ne, which was mixed into the shell during the relaxation step of the hydrodynamic simulation.
The most important effect the metallicity has is the resulting neutron excess and, therefore, lower Ye (due to 22Ne). This Ye is approximately conserved during the duration of the explosive burning, which in the case described here happens on timescales that are too short for β-decays to change the electron fraction while densities are too low for electron capture reactions to drive Ye lower. Effectively, the lower Ye reduces the free proton abundance during freeze-out, which leads to a net decrease in the destruction of 55Co via 55Co(p,γ)56Ni which is the key reaction governing the final yield of 55Mn (see Table 13 of Bravo & Martínez-Pinedo 2012).
Figure 2 shows the tracer particle distribution of Models M10_03 at four different metallicities (increasing from left to right) with color-coded mass fraction of 55Mn (top) and 55Co (bottom). The trends in the nucleosynthetic yields of 55Mn and 55Co produced in the He detonation are visible. The tracer particles of the He detonation are shown in Fig. 3 for comparison. Furthermore, Fig. 2 illustrates that both isotopes, 55Mn and 55Co, are produced in incomplete Si burning. As discussed by Seitenzahl et al. (2013a), 55Co is destroyed in α-rich freeze-out from NSE by 55Co(p, γ)56Ni. The production of 55Mn is, however, several orders of magnitude lower than that of 55Co.
The amount of 55Co produced in the core detonation doubles from lowest to highest assumed metallicity, while the production of 55Mn shows a steeper increase with metallicity. The increase in 55Co is visible in the bottom panel of Fig. 2; more 55Co is produced in the lower temperature and density regime. The presence of 22Ne has the same effect on the nucleosynthesis of the core detonation as on the He detonation (22Ne was mixed into the shell during the relaxation) since the isotopes are produced in the same temperature and density region in both cases. Generally, in both the He and core detonations, it is visible that the presence of 22Ne, and with that the metallicity of the progenitor star, has a strong impact on the production of Mn as suggested by Seitenzahl et al. (2013a).
Manganese is an element that is mostly produced in SNe Ia with core-collapse (CC) SNe contributing to the total production as well. It is not sufficiently known yet what the origin of the solar [Mn/Fe] is. Different explosion scenarios of SNe Ia are usually considered to explain the rise in [Mn/Fe] at [Fe/H] ≥ −1 to solar values (Matteucci & Greggio 1986, Cescutti & Kobayashi 2017; Eitner et al. 2020, Kobayashi et al. 2020) seen in observations (Gratton & Sneden 1988, 1991). Seitenzahl et al. (2013a) state that a source with a super-solar ratio of [Mn/Fe] is needed to explain this trend. Their comparison of the Mn production from different progenitor models leads them to conclude that at least 50% of SNe Ia originate from near-MCh WD explosions. They argue that this is the case because normal freeze-out is necessary to reach a high enough production of 55Co for [Mn/Fe] to become super-solar. The production in incomplete Si burning is not sufficient for this. However, normal freeze-out can only be achieved in near-MCh WDs which have high enough central densities.
Seitenzahl et al. (2013a) examine WD mergers in their study to represent explosions of sub-MCh WDs and investigate a metallicity dependence for the near-MCh WD explosion models. They argue that gravitational settling is needed in order for 22Ne to be sufficiently abundant in the high-density regions to alter the direct 55Mn production. Since the effect is small for near-MCh WDs, it is neglected for sub-MCh WD. In our models, we presume a homogeneous distribution of 22Ne in the core under the assumptions that it was produced homogeneously during the evolution of the zero age main sequence progenitor star and that gravitational settling has a minor effect. This leads to the presence of 22Ne affecting the Mn production in the high-density regime. Our study shows that [Mn/Fe] of all models significantly increases with higher metallicity. This also applies to [Mn/Fe] originating from the core detonation. Accordingly, all models have a super-solar [Mn/Fe] value at 3 Z⊙ (see bottom panel in Fig. 7). The contribution of progenitors with super-solar metallicity to the solar Mn over Fe ratio at [Fe/H] = 0 is not well known. They do not contribute to the ratio at that point in one-zone galactic evolution models. Lach et al. (2020) show that [Mn/Fe] is significantly super-solar in the nucleosynthetic yields of the shell detonation increasing the total Mn-to-Fe ratio. Thus showing that the He detonation plays an important role in the total [Mn/Fe]. A comparison of the 55Mn and 55Co yields originating from the shell and core detonation of Models M08_10, M08_05, and M08_03 (Tables 9–11) confirms that the contribution of the shell detonation becomes more relevant at higher shell masses. The relation is the same among other models with equal core mass.
Final abundances for Model M08_10_001, M08_10_01, M08_10_1, and M08_10_3.
Final abundances for Model M08_05_001, M08_05_01, M08_05_1, and M08_05_3.
Final abundances for Model M08_03_001, M08_03_01, M08_03_1, and M08_03_3.
We point out that Seitenzahl et al. (2013a) use CC SN yields provided by Woosley & Weaver (1995) in their GCE model. These have a strong influence on the predicted evolution of [Mn/Fe] over [Fe/H]. They are similar to those by Nomoto et al. (2013, N13). The chemical evolution calculations presented in Seitenzahl et al. (2013a) would potentially lead to a less stringent requirement for MCh WD explosions if CC SN yields by Limongi & Chieffi (2018, LC18) were used.
The effect of core-shell mixing on [Mn/Fe] is investigated by a comparison of Models M08_10 by Gronow et al. (2021). While one of the models has the core and shell compositions obtained after the relaxation step, the mixing is reset in the other model (see Gronow et al. 2021 for a detailed description of both models). The models have solar metallicity; [Mn/Fe] is about 0.2 in both cases with a difference of a few percent indicating that the mixing caused by the relaxation only has a small effect on the value. Variations in the 55Mn production are minor as well. Some admixture of C into the shell in the initial transition region rather already influences the yields, as described in Yoon et al. (2004) and Gronow et al. (2020).
3.4. Iron and nickel
56Ni is the main product of a SN Ia explosion. Thus, the iron abundance is high as well after the decay of 56Ni. Among those elements the isotopes 54Fe and 58Ni are interesting as they are the next stable isotopes to the α-chain elements 52Fe and 56Ni. Furthermore, 57Ni can be measured from observations (Graur et al. 2016) via its decay to 57Co allowing the determination of 57Ni/56Ni.
An increase in the abundances originating from the He detonation with metallicity, although not as strong as for 55Mn and 55Co, can also be observed for 54Fe and 58Ni. In general, a higher metallicity leads to an increased production of stable IGE nuclides. This can also be observed in the core detonation (see Tables 1–12). The abundances of 54Fe and 58Ni at 3 Z⊙ increase to four times the value found at 0.01 Z⊙. The change in the nucleosynthetic yields is due to the presence of additional neutrons which stem from 22Ne via 22Ne(α,n)25Mg in the α-rich freeze-out regime (Shigeyama et al. 1992). The reaction produces the neutron-rich 25Mg. In subsequent (α,n) and (n,γ) reactions other neutron-rich isotopes are formed up to IGEs, such as 54Fe and 58Ni which have two extra neutrons compared to the α-chain elements 52Fe and 56Ni. Additionally, the neutron, that is freed in the reaction of 22Ne to 25Mg, allows the production of C isotopes in reactions with 20Ne. In this context free p are captured in exchange for α-particles (Chamulak et al. 2007). Contrary to this effect, the abundances of Fe and Ni which are produced in the He detonation are changed as 22Ne and other isotopes alter the leading reactions. These isotopes compose the metallicity in the simulations and serve as seed nuclei for the reactions. As such, 14N(α,p)17O can lead to a speedup of the burning. The material undergoing explosive burning quickly reaches nuclear quasi-statistical equilibrium (QSE), which comprises two equilibrium clusters, around the Si and Fe groups (see also Lach et al. 2020). The clusters are separated by a bottleneck at A ≈45 (Ca/Ti/Sc). This boundary of the QSE clusters depends on Ye and the main nuclear reactions that connect the Si QSE cluster with the Fe-group cluster shift as a function of the neutron excess. At Ye ≈ 0.5 the bottleneck is bypassed with reactions such as the most important bridging flow through 45Sc(p,γ)46Ti, but also 42Ca(α,γ)46Ti and 45Ti(n,γ)46Ti (Woosley et al. 1973) and 44Ti(α,p)47V (Bodansky et al. 1968). Instead, (α,n) and (α,γ) reactions on argon isotopes and (p,n) reactions on potassium isotopes, such as 40Ar(α,n)43Ca, 38Ar(α,γ)42Ca, or 42K(p,n)42Ca, dominate the fluxes upward out of the Si-group at Ye ≈ 0.46. 43Ca(n,γ)44Ca followed by a series of (n,γ) reactions along the Ca-isotopic chain up to 48Ca then dominate the flux into the Fe-group QSE cluster (Hix & Thielemann 1999). A consequence of this shift is the increased production of neutron-rich Fe-group isotopes, like 54Fe and 58Ni, in incomplete Si burning.
Final abundances for Model M11_05_001, M11_05_01, M11_05_1, and M11_05_3.
The production of 56Ni and 58Ni is illustrated in Fig. 4 in the same way as in Fig. 2 for Model M10_03_001 (left) and Model M10_03_3 (right). A comparison shows that the production of 56Ni at lower densities in the incomplete Si burning regime decreases with higher metallicity, though the differences are only weakly pronounced. The same applies to 56Ni produced in the He detonation. Changes in the 58Ni abundances are more visible in Fig. 4. The differences in the 58Ni yields are most prominent in the density regime below 3 × 10⁶ gcm−3, while a small increase is visible in the α-rich freeze-out regime as well.
Timmes et al. (2003) note that the metallicity of the WD influences the electron fraction Ye: an increase in metallicity decreases Ye. A decrease in Ye in turn increases the nucleosynthetic yields of 54 − 58Fe and 57 − 60Ni. This is in agreement with Curtis et al. (2018), who state that a lower Ye supports the production of 57Ni over 56Ni, thus changing the 57Ni/56Ni ratio. This is confirmed in our simulations (see Fig. 5). Shown is the total 57Ni mass over 56Ni mass for all models. Models with the same mass configuration (e.g., all M08_03 models) have the same color and are connected by solid lines. The metallicity increases to the top left and the total mass of the models increases to the top right. Two models (Models M08_10 and M10_03) have higher 56Ni values than the model with the next highest total mass, which is due to the different configurations of the models. For example, the shell mass of Model M08_10, along with the densities present in the shell, allows a production of 56Ni in the He detonation which is on the order of 10−2 M⊙. This is significantly higher than for Model M09_03, and more than balances the small difference of the 56Ni production in the core detonation. It can be seen that 56Ni decreases and 57Ni increases with increasing metallicity. The yields at 0.01 Z⊙ and 0.1 Z⊙ show only small differences, which are marginally visible for Models M11_05_001 and M11_05_01, but overlap for all other models. A comparison to SN 2011fe (case 1 of Dimitriadis et al. 2017) shows that it lies in the range covered by our models. It suggests that Model M09_10_3 can be a good fit and that a WD with this total mass (and possibly mass configuration of core and shell) can be its progenitor. Furthermore, SN 2012cg (Graur et al. 2016) could be explained by a progenitor similar to Model M10_10.
 |
Fig. 5. Mass of 57Ni over 56Ni mass for all models (solid lines). Models of Leung & Nomoto (2020) are added for comparison (dashed lines). The data for SN 2011fe is taken from Dimitriadis et al. (2017) (case 1) and for SN 2012cg from Graur et al. (2016). |
3.5. Nucleosynthetic yields relative to solar values
The variation in the nucleosynthetic abundances is apparent in Figs. 6 and 7. Both figures give the elemental ratio relative to iron with respect to solar ratios (Asplund et al. 2009). For this, radioactive nuclides are decayed to 2 Gyr. Figure 6 shows the elemental ratios for Models M08_03 (top) and M10_03 (bottom) at four different metallicities, while Fig. 7 illustrates the elemental ratios of all models sorted by metallicity. The models with the lowest metallicity of 0.01 Z⊙ at the top and at 3 Z⊙ at the bottom.
 |
Fig. 6. Elemental ratios relative to Fe compared to solar ratios for Models M08_03 (top) and M10_03 (bottom) at four different metallicities. |
 |
Fig. 7. Elemental ratios relative to Fe compared to solar ratios for all models, sorted by increasing metallicity from top to bottom: 0.01 Z⊙, 0.1 Z⊙, 1 Z⊙, and 3 Z⊙. |
The influence of the metallicity on the elemental ratios is visible in Fig. 6. The two panels show similar trends for the two models. Among these is the previously discussed increase in Mn with increasing metallicity. It can also be seen that the Ti production decreases (a little) with increasing metallicity along with Cr. Generally, this decrease indicates a better match to observables as Ti and Cr often cause discrepancies in early observations (Höflich et al. 1996; Kromer et al. 2010). However, the decreasing values here are caused by changes in the nucleosynthetic yields coming from the core detonation and not the He detonation. An improved reproduction of observations is therefore not expected. One additional trend is the odd-even effect in the production of intermediate-mass elements (IMEs) (see Peterson 1981, and references therein). Elements with an even atomic number are mostly produced in the α-chain. The pairing effect results in a stable structure due to the high nuclear binding energy. In contrast, the nuclear binding energy of elements with an odd atomic number is low. The production of these elements further depends on the neutron excess of the white dwarf (Wheeler et al. 1989) (see Figs. 6 and 7). This is mostly due to the fact that stabilities shift toward neutron-rich isotopes for heavier elements.
A drop-off in the elemental ratios is noticeable for copper and zinc while cobalt is produced at sub-solar values as well. However, the effect decreases with increasing metallicity. Models with a more massive He shell tend to reach higher values of Co, Cu, and Zn than the respective comparison models with lower shell masses at the same metallicity (see Fig. 7). This confirms that Cu and Zn are mostly produced in the He detonation. The sub-solar production of the three elements Co, Cu, and Zn is typical for pure detonation models, as pointed out by Lach et al. (2020). Generally some of these features are present in all models as shown in Fig. 7 and the relations between the models mostly stay the same with changing metallicity. A comparison of models with the same core mass at the various metallicities allows us to detect the influence of the He detonation on the elemental ratios, which is discussed in Lach et al. (2020) and confirmed here.
The super-solar production of Ti, V, and Cr is caused by the He detonation. However, the values are almost solar for Models M08_03, M09_03, and M10_03. Model M10_03 is an especially good fit at all metallicities. The other models match Ti and V better than Cr and also show larger deviations toward higher metallicity. The Mn production is almost solar with an increasing trend at higher metallicity. At all metallicities it is visible that the Mn-to-Fe ratio is lower with increasing core mass as a high [Mn/Fe] stems from the Mn production in the shell. The relative contribution of Mn coming from the He detonation decreases with increasing core mass. Additionally, more Fe is produced at the higher densities in WDs with higher mass cores because burning extends to higher mass elements in these cases. Therefore, at solar metallicity only a few models with sufficient mass to produce normal SNe Ia reach solar [Mn/Fe] (Models M09_05_1, M09_10_1, and M10_05_1). However, all models have super-solar values at a metallicity of 3 Z⊙.
3.6. Impact on observables
We have carried out radiative transfer simulations for a representative subset of models (Models M10_03) to investigate the influence of metallicity on the predicted observables. These will be presented in detail in a follow-up paper. However, we discuss the results qualitatively here.
Low metallicities (≤Z⊙) do not have a significant impact on the predicted photospheric phase light curves and spectra. At early times, double detonation simulations tend to show colors that are too red compared to observations of normal SNe Ia, predominantly due to the production of heavy elements in the shell detonation (Cr, Ti, and IGEs, e.g., Kromer et al. 2010; Gronow et al. 2020). As discussed above, increasing the metallicity does not significantly impact the production of these elements in the shell detonation. Therefore, it is not unexpected that the metallicity of the model does not substantially alter the agreement with observations for low to moderate values. At high metallicity (3 Z⊙) there is a noticeable impact on the predicted observables, such that the models are fainter and redder. This can be attributed to the lower masses of 56Ni that are produced at this high metallicity, leading to lower ejecta temperatures and redder colors.
Although the impact on the early observables is relatively modest, metallicity can become more important when considering late times because the metallicity affects the ratio of stable to radioactive isotopes produced in the model. In the nebular phase the relatively rapid decay of 56Ni means that 58Ni becomes the dominant Ni isotope. Therefore, the abundance of this stable isotope can be directly probed in nebular spectra (Ruiz-Lapuente & Lucy 1992). Increasing metallicity provides a mechanism by which sub-MCh models can produce increasing amounts of stable Ni, although it remains unclear whether conditions in sub-MCh models can yield [Ni II] emission to the degree required by data (Shingles et al. 2020; Wilk et al. 2020).
4. Comparison to previous work
Other models involving a nonzero metallicity of the zero age main sequence progenitor were investiagted by Shigeyama et al. (1992), Timmes et al. (2003), Sim et al. (2010), Shen et al. (2018), and Leung & Nomoto (2020). In the following we compare our models to theirs where possible. We note that only Leung & Nomoto (2020) examine a sub-MCh WD with a He shell; all the others study detonations in bar sub-MCh CO WD. A discussion of the models at solar metallicity was already carried out in Gronow et al. (2021).
Lach et al. (2020) discuss the nucleosynthesis results of Model M10_05_1 (Model M2a⊙ in their paper) in connection with other explosion scenarios, such as delayed detonations or pure deflagrations, also analyzing their impact on GCE. A specific focus is given on Mn, Zn, and Cu. Similar to other work (e.g., Seitenzahl et al. 2013a), they confirm metallicity as an important parameter for the production of Mn which we also find in the more detailed metallicity study presented here. We further confirm that the Cu production increases with metallicity though it is still underproduced compared to solar values also in our highest metallicity models.
Flörs et al. (2019) use super-solar values of Mn and Ni to differentiate between MCh and sub-MCh WDs as progenitors in nebula spectra. As pointed out by Lach et al. (2020) the distinction between both models is not that straightforward. At high metallicity (1 Z⊙) our models with a core mass of at least 1.0 M⊙ reach at least solar values for both elements.
Sim et al. (2010) explore detonations in a variety of sub-MCh CO WDs at different masses. Only one of the models is calculated at about 3 Z⊙. This model has a total mass of 1.06 M⊙, which is similar to our Models M10_05. However, their model does not have a He shell. They find that more stable IGEs are produced compared to the same model at zero metallicity. Fig. 3 of Sim et al. (2010) also shows that less 56Ni is synthesized in the inner and fewer IMEs in the outer regions. These changes are attributed to the presence of 22Ne which is used to represent metallicity in the WD. While it is not possible to compare the respective detailed nucleosynthetic yields, our models agree with the trends found by Sim et al. (2010).
A similar model (WD without He shell) is calculated by Shen et al. (2018). However, they carry out a parameter study involving different WD masses and metallicities. The Shen et al. method is similar to ours; they also examine four different metallicities of the main sequence progenitor star, namely 0, 0.5, 1, and 2 Z⊙. They use 22Ne and 56Fe as proxies for the metallicity in the hydrodynamic simulation. They find, as we do, that the production of 56Ni decreases with increasing metallicity while other stable IGEs are produced. A rough comparison of the Shen et al. (2018) models can be carried out to the yields originating from the core detonation in our models with the least massive He shells. Generally, the same behavior is found in all models. The yields of some isotopes, such as 32S and 40Ca, are within a few perent of each other at 0.01 Z⊙ (compared to zero metallicity of Shen et al. 2018) and Z⊙. Shen et al. (2018) compare their solar metallicity models to those of Blondin et al. (2017) and argue that the discrepancy in the 56Ni abundance is caused by the smaller nuclear reaction network used by Blondin et al. (2017). We point out that the differences in the 56Ni abundance reach up to two-thirds of the values found by Shen et al. (2018) depending on the WD mass. The models of Shen et al. (2018), however, match the models of Shigeyama et al. (1992) relatively well at 2 Z⊙.
The models developed by Shigeyama et al. (1992) are calculated in 1D and involve sub-MCh CO WDs without a He shell. They find an increase in the production of neutron-rich IGEs due to the presence of 22Ne which they use to approximate metallicity in the same way as done in our study. A more detailed comparison is not feasible due to the different setups of the models.
Timmes et al. (2003) predict a relation between the amount of produced 56Ni and the metallicity of the white dwarf. Their 1D models of MCh WDs show a decrease in 56Ni by 25% going from 0.3 Z⊙ to 3 Z⊙. Shen et al. (2018) find a similar trend when the metallicity is changed from 0 to 2 Z⊙ but the amount of the reduction varies with WD mass in their case. Models with a mass of 0.8 M⊙ show a decrease of 50% in 56Ni and models of a 1.0 M⊙ WD only of 10%. Bravo (2019) carry out a parameter study involving sub-MCh CO WDs with masses between 0.88 M⊙ and 1.15 M⊙ at varying metallicities. Their 56Ni abundances show a similar decrease of about 17%. Our models agree with the trend found in these previous studies. The decrease, however, is lower, with values from 12% to 21%. While the difference in the 56Ni abundance at 0.01 Z⊙ and 3 Z⊙ is of the same order for most models, our model with the smallest total mass shows the highest value of 21%. The derived linear relation of Timmes et al. (2003) assumes a fixed 56Ni mass of 0.6 M⊙ produced in a normal SN Ia. However, this mass is in large part influenced by the total mass of the white dwarf. Lower mass stars produce significantly less 56Ni, as can be seen in Tables 1–12. The relative change of this mass with increasing metallicity is therefore larger at lower total masses.
Seitenzahl et al. (2013b) and Leung & Nomoto (2018) carry out studies involving different metallicities for near-MCh WDs. A comparison of the models is therefore the only possible analog to the comparison with the studies of Sim et al. (2010) and Shen et al. (2018). Instead, we focus on a study by Leung & Nomoto (2020) who investigate double detonations of sub-MCh WDs. They look into core and shell masses similar to those presented in our paper. However, our models reach lower core and shell masses. In contrast to our models, Leung & Nomoto (2020) do not consider any mixing between core and shell. This has an influence on the nucleosynthetic yields produced in the He detonation as shown by Gronow et al. (2020). The metallicities they include in their study reach from 0 Z⊙ to 5 Z⊙, which is approximated by 22Ne similar to our hydrodynamic models. The metallicity is treated more accurately in the postprocessing step of our models as 14N is included as a proxy for the metallicity in the He shell of the hydrodynamic simulation, while Leung & Nomoto (2020) do not include this in the hydrodynamic and postprocessing calculations (Leung, priv. comm.). In addition, the solar abundances of Asplund et al. (2009) are scaled to the respective metallicity (see Sect. 2). Lach et al. (2020) compare an approach that only includes 22Ne in the postprocessing calculation as a proxy for the metallicity (also used in Leung & Nomoto 2020 and earlier works) with the approach presented here and in their own study. The simulations by Leung & Nomoto (2020) are only carried out in 2D and cover one-quarter of the star. Furthermore, their hydrodynamic simulations only include seven isotopes in the nuclear reaction network. This is not best suited to cover the energetics of the shell detonation, as pointed out by Shen et al. (2018) and Townsley et al. (2019). The nuclear network used in the hydrodynamic models of Gronow et al. (2021) comprises 55 isotopes to match the one of Townsley et al. (2019). This allows us to cover the He and Si burning more accurately than with a small nuclear network. Additionally, the level-set method used in Leung & Nomoto (2020) is not optimal to follow the detonation front at low densities present in the shell and in low-mass WDs in general (Gronow et al. 2020, 2021). The energy release and nuclear burning are not calculated self-consistenly using this method (Gronow et al. 2020). Instead, the energy release in the burning is treated in a parametric way that requires a calibration for the simulation (Fink et al. 2010). The AREPO code instead enables a coupling of the nuclear network to the hydrodynamics (Pakmor et al. 2013). The groups H, I, and J of Leung & Nomoto (2020) focus on the effect of the metallicity on the explosion characteristics and nucleosynthetic yields. Of these models, Group I is most similar to Model M10_10 as it has a total mass of 1.1 M⊙ with a 0.1 M⊙ shell. Leung & Nomoto (2020) find that the production of 56Ni decreases with increasing metallicity. Similarly to Timmes et al. (2003) they find a decrease of about 20%. They conclude that the metallicity has little to no impact on the explosion energy, final energy, detonation channel, detonation position, and time of core ignition. This supports our computational approach in which we do not calculate the hydrodynamic simulation for each of our 44 models, but use the hydrodynamic simulation of 11 models and follow up on them with detailed nucleosynthesis calculations at different metallicities in a postprocessing step. A detailed analysis of the models of Group I in Leung & Nomoto (2020) shows an increase in the production of stable isotopes (both IMEs and IGEs), while the final yields of the α-chain elements are not affected by the metallicity. The difference of the neutron-rich isotopes can be as high as four orders of magnitude, according to Leung & Nomoto (2020). We find a similar increase, most significantly in the yields of 55Mn (see Sect. 3.3). Tables 6 and 7 in Leung & Nomoto (2020) list nucleosynthetic yields of stable isotopes and of some radioactive isotopes of the benchmark model in Group I. Here seven different metallicities are included, of which three are part of our study. Comparable yields of Model M10_10 are given in the appendix and the appendix of Gronow et al. (2021). A comparison of the abundances shows that the 56Ni production is higher in our models though the decreasing trend with metallicity is similar. Other isotopes confirm that our models and the models by Leung & Nomoto (2020) agree in the dependency of the respective isotope production on metallicity. However, a discrepancy is visible in the yields of selected isotopes. 30Si and 34S are produced less in our simulations, showing differences of one order of magnitude in some cases. Smaller differences are apparent for 44Ti (yields by Leung & Nomoto 2020 are higher), 55Mn (yields by Leung & Nomoto 2020 are lower) and 64Zn (yields by Leung & Nomoto 2020 are lower). In all three cases our models give better matches relative to solar values since approximately solar values of [Mn/Fe] are reached and the under- and overproduction of [Zn/Fe] and [Ti/Fe] is decreased, respectively. Figure 5 illustrates the abundances of 57Ni over 56Ni, as discussed in Sect. 3.4. For comparison, three models of Leung & Nomoto (2020) are included (at zero, 0.1, 1, and 5 Z⊙, dashed lines). They represent models with a total mass of 1.0 M⊙ and 1.1 M⊙, and follow the same trend as our models, both regarding metallicity and 56Ni mass. However, the models of Leung & Nomoto (2020) show higher values of 57Ni. The differences in the nucleosynthesis yields of our models compared to Leung & Nomoto (2020) are attributed to the different numerical treatments. The details of the approach used for the hydrodynamic simulations of our models are given in Gronow et al. (2020, 2021) and are more accurate for the multi-dimensional structure of the double detonation. The size of the nuclear reaction network is critical to capturing the energetics accurately, as pointed out earlier.
5. Influence on galactic chemical evolution
In this section we incorporate the metallicity-dependent sub-MCh WD explosion yields presented in Sect. 3 in the GCE code OMEGA+ (Côté et al. 2018) in order to explore their impact on the predicted evolution of Mn in the solar neighborhood (see also Lach et al. 2020). OMEGA+ is a two-zone model that consists of a central galaxy surrounded by a large gas reservoir that fills the host dark matter halo. In addition to the star formation and chemical enrichment processes, the code includes parameterized large-scale gas circulation processes such as galactic inflows and outflows. For this work, the GCE code is calibrated to broadly reproduce general properties of the Milky Way, such as the current star formation rate, gas inflow rate, stellar-to-gas mass ratio, and CC and Type Ia SN rates2.
Although OMEGA+ can account for a wide range of astrophysical sites, we only include in this work the contribution of CC SNe, low- and intermediate-mass (LIMS) stars, and SNe Ia. The nucleosynthesis ejecta are assumed to mix homogeneously within the galactic gas, but the lifetime of stars and the delay-time distribution (DTD) of SNe Ia are taken into account in the enrichment process (see Ritter et al. 2018 for more details). Given the exploratory nature of our GCE calculations, we assume that all SNe Ia are sub-MCh explosions, with the goal of exploring how such a SN Ia channel can contribute to the production of Mn in our Galaxy. As a test case, we adopt the metallicity-dependent yields for the model with an initial core of 1 M⊙ and a shell mass of 0.03 M⊙, Model M10_03. Although the yields are metallicity dependent, we adopt the same DTD for all metallicities, which comes from the double detonation SN Ia prescription with a He shell found in Ruiter et al. (2014). This DTD is normalized such that about 10−3 SNe Ia occur in total per unit of stellar mass formed, which is sufficient to account for the overall SN Ia rate observed in nearby galaxies (see Table 5 in Côté et al. 2016).
In all of our GCE calculations, the mass- and metallicity-dependent yields for LIMS stars are taken from Cristallo et al. (2015). For massive stars we consider both the mass- and metallicity-dependent yields of LC18 and N13. For LC18 we adopt the mixture of rotation velocities introduced and described in Prantzos et al. (2018), which depends on metallicity. These yields are applied to all massive stars from 8 to 100 M⊙. For N13 we assume that 50% of the stars above an initial mass of 20 M⊙ end up as hypernovae, and apply the yields to all massive stars from 8 to 50 M⊙. This lower maximum threshold mass relative to the LC18 case was chosen in order to avoid overproducing the amount of metals synthesized by massive stars.
Figure 8 shows the predicted evolution of [Mn/Fe] as a function of [Fe/H] in the solar neighborhood, assuming different CC SN yields and different SN Ia treatments. The required contribution of SNe Ia in order to reproduce the upward Mn trend depends on the adopted CC SN yields (see also Lach et al. 2020). As can be seen from the gray solid line, the massive star yields of LC18 contribute to the rise of Mn at [Fe/H] > −0.5 (upper panel), as opposed to the yields of N13 (lower panel). When using our metallicity-dependent SN Ia yields (orange line) along with the massive star yields of LC18, our prediction agrees relatively well with the spectroscopic data (Battistini & Bensby 2015). We point out that the CC SN yields used in Seitenzahl et al. (2013a) are similar to N13. Accordingly the chemical evolution of Mn presented in Fig. 1 of Seitenzahl et al. (2013a) (thick blue line) is similar to the one in the bottom panel of Fig. 8 (orange line).
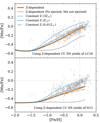 |
Fig. 8. Chemical evolution of Mn in the solar neighborhood, as predicted by OMEGA+ (lines, Sect. 5) and derived from stellar spectroscopy (dots, Battistini & Bensby 2015). All predictions include the contribution of Type Ia and CC SNe, using the massive star yields of Limongi & Chieffi (2018, LC18) and Nomoto et al. (2013, N13) for the top and bottom panels, respectively. In each panel the three blue lines show our predictions when we assume that all SNe Ia eject the yields of a given metallicity. The orange line shows our prediction when adopting our metallicity-dependent SN Ia yields. The gray line shows the metallicity-dependent case, but when SNe Ia are assumed to only eject Fe, without Mn, while CC SNe still eject both Fe and Mn. |
To visualize the impact of using metallicity-dependent SN Ia yields, we ran three additional GCE calculations in which we assumed that all SNe Ia eject the yields of a specific metallicity (0.01 Z⊙, Z⊙, and 3 Z⊙, see blue lines in Fig. 8). As expected, using higher metallicity yields lead to higher [Mn/Fe] ratios. Although our metallicity-dependent predictions are similar to the ones with a constant metallicity of 0.01 Z⊙ and Z⊙, the effect of metallicity is still important for extending and maintaining the upward [Mn/Fe] trend at [Fe/H] > 0.
In Fig. 9, we show our predicted solar elemental abundances when using our metallicity-dependent SN Ia yields along with the LC18 yields (top) and N13 yields (bottom). As described above, using the LC18 yields suggests that Mn could be significantly produced by massive stars, which would reduce the need for SNe Ia originating from explosions of MCh WDs. When assuming that sub-MCh double detonations are the dominant SN Ia channel, our GCE model can account for more than 80% of the solar Mn abundance. However, this prediction is affected by several uncertainties, including the exact number of SNe Ia that occurred in the Milky Way prior to the formation of the Solar System. Furthermore, the use of other CC SNe yields still requires some contribution of MCh WD explosions. The bottom panel in Fig. 9 illustrates this as the Mn production is much lower using N13 yields compared with LC18 yields.
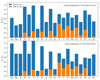 |
Fig. 9. Predicted solar elemental distribution normalized to the solar abundances of Asplund et al. (2009). The blue bars show our chemical evolution prediction when combining the contribution of CC SNe (top: Limongi & Chieffi 2018, bottom: Nomoto et al. 2013), low- and intermediate-mass stars (Cristallo et al. 2015), and SNe Ia (using the metallicity-dependent yields from this work). The orange bands show the specific contrition of SNe Ia within the combined predicted abundances. |
Given the nucleosynthesis signature of our sub-MCh models, the maximum contribution of these SNe Ia to the evolution of Mn is limited by other elements. In particular, a substantial amount of Ti and Cr are produced in the ejecta of the adopted SN Ia models and, as shown in Fig. 9, our GCE prediction already fills the solar composition for these elements. Adjusting the contribution of SNe Ia to reproduce 100% of the solar Mn abundance would lead to an overproduction of Ti and Cr. Calcium and nickel are overestimated in our GCE calculations when using the massive star yields of LC18, but this is not the case when using the N13 yields.
6. Conclusions
Our parameter study followed up on previous work by Gronow et al. (2021). Explosions of sub-MCh WDs with varying core and shell masses were simulated at different metallicities. The core mass was in the range 0.8 M⊙ – 1.1 M⊙, and the initial shell mass in the range 0.02 M⊙ to 0.1 M⊙. Models at solar metallicity of the zero age main sequence progenitor have been presented by Gronow et al. (2021). We included metallicities of 0.01, 0.1, and 3 Z⊙ and showed that the results of the postprocessing step at these metallicities are in good agreement with a full re-calculation of the hydrodynamic model allowing to decrease the computational costs of our study.
We found that the influence of the metallicity varies with the model. The impact is larger on the nucleosynthetic yields of the core detonation than on those of the He detonation. In accordance with this, the nucleosynthetic yields produced in the He detonation do not show significant changes with varying metallicity up to elements as heavy as 44Ti. However, the amount of 55Mn produced in the He detonation increases by one order of magnitude with each metallicity increase (from 0.01 Z⊙ to 0.1 Z⊙ to 1 Z⊙ to 3 Z⊙) since the presence of 14N and 22Ne (mixed into the shell during the relaxation) supports its production (see Sect. 3.3). The production of 54Fe and 58Ni increases with metallicity as well. This is caused by a shift in the leading reactions toward neutron-rich isotopes.
This neutron-excess also results in a change in the nucleosynthetic yields produced in the core detonation. For Z = 3 Z⊙, 54Fe and 58Ni increase to four times the value obtained at 0.01 Z⊙. The effect is particularly strong on 55Mn (Seitenzahl et al. 2013a) causing a significant increase with metallicity.
The models are further analyzed regarding changes in the elemental ratios relative to Fe compared to solar values. All models show similar features. Most prominently, an odd-even effect is visible in the production of IMEs. This is due to the higher stability of elements with an even atomic number. In addition, the production of elements with an odd atomic number depends on the metallicity of the white dwarf (increasing with metallicity). The models also confirm that Cu and Zn are largely produced in He detonations. Nevertheless, double detonations have sub-solar Cu-to-Fe and Zn-to-Fe ratios, due to the sub-solar production of Co, Cu, and Zn in the core detonation. This is a feature of a pure detonation (Lach et al. 2020) and suppresses a rise in the ratio to solar values. The contribution of the core detonation to the ratio of the double detonation is proportionally larger than that of the He detonation. The super-solar production of 44Ti is caused by the He detonation. However, we do point out that some models reproduce solar values. While the values of [Cu/Fe] and [Zn/Fe] are higher for models with larger He shells, models with lower He shell masses show a better match with observations. Both factors need to be taken into account when a model of a sub-MCh WD is varified as progenitor of a SN Ia.
Only few parameter studies involving different metallicities of a sub-MCh WD were carried out (Shigeyama et al. 1992; Sim et al. 2010; Shen et al. 2018; Leung & Nomoto 2020). Among them only Leung & Nomoto (2020) analyze explosions of WDs with a He shell. We nevertheless see the same relative change in the nucleosynthetic yields produced in the core detonation and the pure detonations of sub-MCh WDs by Shigeyama et al. (1992), Sim et al. (2010), and Shen et al. (2018). The relation between metallicity and 56Ni production found by Timmes et al. (2003) and Shen et al. (2018) is confirmed. The dependence is not as strong in our models as the increase in the metallicity only leads to a decrease of about 13% on average. It is, however, in agreement with a change of 15% found by Ohkubo et al. (2006) who consider metallicities between 0.001 Z⊙ and 0.05 Z⊙.
The initial mass configurations of some models in Leung & Nomoto (2020) are in good agreement with our M10_10 models. The nucleosynthetic yields of some isotopes show differences. For example, the 56Ni production is higher in our models and the 30Si and 34S production lower. However, the trends in the production of the isotopes are the same depending on metallicity. The differences in the detailed nucleosynthetic yields are presumably caused by the different numerical treatments and initial setup.
Our parameter study shows that super-solar values of Mn can be reached in double detonations of sub-MCh WDs (see also Lach et al. 2020). If such a channel is assumed to be the dominant source of SNe Ia, explosions of sub-MCh WDs could contribute significantly to the increasing [Mn/Fe] trend at [Fe/H] > −1 observed in the solar neighborhood. Seitenzahl et al. (2013a) find that a contribution of at least 50% by MCh WD to SNe Ia is necessary to reach solar values of [Mn/Fe] (see also Eitner et al. 2020; Kobayashi et al. 2020). This requirement is weakened by our analysis indicating that a larger fraction of SNe Ia originates from sub-MCh WDs if CC SN yields of LC18 are considered. When adopting the massive-star yields of LC18, along with our metallicity-dependent SN Ia yields, our GCE predictions can account for more than 80% of the solar Mn, without the contribution of MCh WD explosions. It is important that the contribution of the He shell detonation be included in the models. The Mn production during this detonation significantly raises the total Mn-to-Fe ratio. Our GCE results are obtained from a rather simplified galaxy model, and should therefore be taken as exploratory.
Acknowledgments
We thank Shing-Chi Leung for providing details on the treatment of metallicity effects in his simulations. This work was supported by the Deutsche Forschungsgemeinschaft (DFG, German Research Foundation) – Project-ID 138713538 – SFB 881 (‘The Milky Way System”, subproject A10). SG, FL, and FKR acknowledge support by the Klaus Tschira Foundation. BC was supported by the ERC Consolidator Grant (Hungary) funding scheme (Project RADIOSTAR, G.A. n. 724560) and by the Lendület grant (LP17- 2014) of the Hungarian Academy of Sciences. IRS was supported by the Australian Research Council through grant number FT160100028. This article is based upon work from the “ChETEC” COST Action (CA16117), supported by COST (European Cooperation in Science and Technology). CEC acknowledges support by the European Research Council (ERC) under the European Union’s Horizon 2020 research and innovation programme under grant agreement No. 759253. NumPy and SciPy (Oliphant 2007), IPython (Pérez & Granger 2007), and Matplotlib (Hunter 2007) were used for data processing and plotting. The authors gratefully acknowledge the Gauss Centre for Supercomputing e.V. (www.gauss-centre.eu) for funding this project by providing computing time on the GCS Supercomputer JUWELS (Jülich Supercomputing Centre 2019) at Jülich Supercomputing Centre (JSC). This work was performed using the Cambridge Service for Data Driven Discovery (CSD3), part of which is operated by the University of Cambridge Research Computing on behalf of the STFC DiRAC HPC Facility (www.dirac.ac.uk). The DiRAC component of CSD3 was funded by BEIS capital funding via STFC capital grants ST/P002307/1 and ST/R002452/1 and STFC operations grant ST/R00689X/1. DiRAC is part of the National e-Infrastructure. This research was undertaken with the assistance of resources from the National Computational Infrastructure (NCI Australia), an NCRIS enabled capability supported by the Australian Government.
References
- Asplund, M., Grevesse, N., Sauval, A. J., & Scott, P. 2009, ARA&A, 47, 481 [NASA ADS] [CrossRef] [Google Scholar]
- Battistini, C., & Bensby, T. 2015, A&A, 577, A9 [NASA ADS] [CrossRef] [EDP Sciences] [Google Scholar]
- Bildsten, L., & Hall, D. M. 2001, ApJ, 549, L219 [Google Scholar]
- Blondin, S., Dessart, L., Hillier, D. J., & Khokhlov, A. M. 2017, MNRAS, 470, 157 [Google Scholar]
- Bodansky, D., Clayton, D. D., & Fowler, W. A. 1968, ApJS, 16, 299 [NASA ADS] [CrossRef] [Google Scholar]
- Brachwitz, F., Dean, D. J., Hix, W. R., et al. 2000, ApJ, 536, 934 [NASA ADS] [CrossRef] [Google Scholar]
- Bravo, E. 2019, A&A, 624, A139 [NASA ADS] [CrossRef] [EDP Sciences] [Google Scholar]
- Bravo, E., & Martínez-Pinedo, G. 2012, Phys. Rev. C, 85, 055805 [NASA ADS] [CrossRef] [Google Scholar]
- Bravo, E., Domínguez, I., Badenes, C., Piersanti, L., & Straniero, O. 2010, ApJ, 711, L66 [NASA ADS] [CrossRef] [Google Scholar]
- Bravo, E., Badenes, C., & Martínez-Rodríguez, H. 2019, MNRAS, 482, 4346 [NASA ADS] [CrossRef] [Google Scholar]
- Cescutti, G., & Kobayashi, C. 2017, A&A, 607, A23 [NASA ADS] [CrossRef] [EDP Sciences] [Google Scholar]
- Cescutti, G., Matteucci, F., Lanfranchi, G. A., & McWilliam, A. 2008, A&A, 491, 401 [NASA ADS] [CrossRef] [EDP Sciences] [Google Scholar]
- Chamulak, D. A., Brown, E. F., & Timmes, F. X. 2007, ApJ, 655, L93 [CrossRef] [Google Scholar]
- Côté, B., Ritter, C., O’Shea, B. W., et al. 2016, ApJ, 824, 82 [CrossRef] [Google Scholar]
- Côté, B., Silvia, D. W., O’Shea, B. W., Smith, B., & Wise, J. H. 2018, ApJ, 859, 67 [CrossRef] [Google Scholar]
- Cristallo, S., Straniero, O., Piersanti, L., & Gobrecht, D. 2015, ApJS, 219, 40 [Google Scholar]
- Curtis, S., Ebinger, K., Fröhlich, C., et al. 2018, ApJ, 870, 2 [NASA ADS] [CrossRef] [Google Scholar]
- de los Reyes, M. A., Kirby, E. N., Seitenzahl, I. R., & Shen, K. J. 2020, ApJ, 891, 85 [NASA ADS] [CrossRef] [Google Scholar]
- Deloye, C. J., & Bildsten, L. 2002, ApJ, 580, 1077 [Google Scholar]
- Dimitriadis, G., Sullivan, M., Kerzendorf, W., et al. 2017, MNRAS, 468, 3798 [NASA ADS] [CrossRef] [Google Scholar]
- Eitner, P., Bergemann, M., Hansen, C. J., et al. 2020, A&A, 635, A38 [NASA ADS] [CrossRef] [EDP Sciences] [Google Scholar]
- Fink, M., Röpke, F. K., Hillebrandt, W., et al. 2010, A&A, 514, A53 [NASA ADS] [CrossRef] [EDP Sciences] [Google Scholar]
- Flörs, A., Spyromilio, J., Taubenberger, S., et al. 2019, MNRAS, 491, 2902 [Google Scholar]
- García-Berro, E., Althaus, L. G., Córsico, A. H., & Isern, J. 2008, ApJ, 677, 473 [Google Scholar]
- Gratton, R. G., & Sneden, C. 1988, A&A, 204, 193 [NASA ADS] [Google Scholar]
- Gratton, R. G., & Sneden, C. 1991, A&A, 241, 501 [NASA ADS] [Google Scholar]
- Graur, O., Zurek, D., Shara, M. M., et al. 2016, ApJ, 819, 31 [NASA ADS] [CrossRef] [Google Scholar]
- Greggio, L., & Renzini, A. 1983, A&A, 118, 217 [NASA ADS] [Google Scholar]
- Gronow, S., Collins, C., Ohlmann, S. T., et al. 2020, A&A, 635, A169 [NASA ADS] [CrossRef] [EDP Sciences] [Google Scholar]
- Gronow, S., Collins, C. E., Sim, S. A., & Röpke, F. K. 2021, A&A, 649, A155 [NASA ADS] [CrossRef] [EDP Sciences] [Google Scholar]
- Hashimoto, M. A., Hanawa, T., & Sugimoto, D. 1983, PASJ, 35, 1 [NASA ADS] [Google Scholar]
- Hix, W. R., & Thielemann, F. 1999, ApJ, 511, 862 [NASA ADS] [CrossRef] [Google Scholar]
- Höflich, P., Khokhlov, A., Wheeler, J. C., et al. 1996, ApJ, 472, L81 [Google Scholar]
- Höflich, P., Wheeler, J. C., & Thielemann, F. K. 1998, ApJ, 495, 617 [CrossRef] [Google Scholar]
- Howard, W. M., Goriely, S., Rayet, M., & Arnould, M. 1993, Nuclei in the Cosmos, 2, 607 [NASA ADS] [Google Scholar]
- Hunter, J. D. 2007, Comput. Sci. Eng., 9, 90 [Google Scholar]
- Iwamoto, K., Brachwitz, F., Nomoto, K., et al. 1999, ApJS, 125, 439 [NASA ADS] [CrossRef] [Google Scholar]
- Jülich Supercomputing Centre 2019, J. Large-Scale Res. Facil., 5 [Google Scholar]
- Khokhlov, A. M. 1984, Sov. Astron. Lett., 10, 123 [NASA ADS] [Google Scholar]
- Khokhlov, A. M., & Érgma, É. V. 1985, Astrofizika, 23, 605 [Google Scholar]
- Kobayashi, C., Tsujimoto, T., Nomoto, K., Hachisu, I., & Kato, M. 1998, ApJ, 503, L155 [NASA ADS] [CrossRef] [Google Scholar]
- Kobayashi, C., Leung, S.-C., & Nomoto, K. 2020, ApJ, 895, 138 [CrossRef] [Google Scholar]
- Kromer, M., Sim, S. A., Fink, M., et al. 2010, ApJ, 719, 1067 [Google Scholar]
- Kromer, M., Ohlmann, S., & Röpke, F. K. 2017, Mem. Soc. Astron. Ital., 88, 312 [Google Scholar]
- Lach, F., Roepke, F. K., Seitenzahl, I. R., et al. 2020, A&A, 644, A118 [NASA ADS] [CrossRef] [EDP Sciences] [Google Scholar]
- Langanke, K., & Martínez-Pinedo, G. 2001, At. Data Nucl. Data Tables, 79, 1 [NASA ADS] [CrossRef] [Google Scholar]
- Lentz, E. J., Baron, E., Branch, D., Hauschildt, P. H., & Nugent, P. E. 2000, ApJ, 530, 966 [NASA ADS] [CrossRef] [Google Scholar]
- Leung, S.-C., & Nomoto, K. 2018, ApJ, 861, 143 [Google Scholar]
- Leung, S.-C., & Nomoto, K. 2020, ApJ, 888, 80 [Google Scholar]
- Limongi, M., & Chieffi, A. 2018, ApJS, 237, 13 [NASA ADS] [CrossRef] [Google Scholar]
- Matteucci, F., & Greggio, L. 1986, A&A, 154, 279 [NASA ADS] [Google Scholar]
- Mazzali, P. A., & Podsiadlowski, P. 2006, MNRAS, 369, L19 [NASA ADS] [CrossRef] [Google Scholar]
- McWilliam, A. 1997, ARA&A, 35, 503 [NASA ADS] [CrossRef] [Google Scholar]
- Meakin, C. A., Seitenzahl, I., Townsley, D., et al. 2009, ApJ, 693, 1188 [NASA ADS] [CrossRef] [Google Scholar]
- Nomoto, K., Kobayashi, C., & Tominaga, N. 2013, ARA&A, 51, 457 [CrossRef] [Google Scholar]
- North, P., Cescutti, G., Jablonka, P., et al. 2012, A&A, 541, A45 [NASA ADS] [CrossRef] [EDP Sciences] [Google Scholar]
- Nugent, P., Baron, E., Branch, D., Fisher, A., & Hauschildt, P. H. 1997, ApJ, 485, 812 [Google Scholar]
- Ohkubo, T., Umeda, H., Nomoto, K., & Yoshida, T. 2006, in Origin of Matter and Evolution of Galaxies, eds. S. Kubono, W. Aoki, T. Kajino, T. Motobayashi, & K. Nomoto, AIP Conf. Ser., 847, 458 [NASA ADS] [CrossRef] [Google Scholar]
- Oliphant, T. E. 2007, Comput. Sci. Eng., 9, 10 [NASA ADS] [CrossRef] [Google Scholar]
- Pakmor, R., Edelmann, P., Röpke, F. K., & Hillebrandt, W. 2012, MNRAS, 424, 2222 [Google Scholar]
- Pakmor, R., Kromer, M., Taubenberger, S., & Springel, V. 2013, ApJ, 770, L8 [Google Scholar]
- Pérez, F., & Granger, B. E. 2007, Comput. Sci. Eng., 9, 21 [Google Scholar]
- Peterson, R. C. 1981, ApJ, 244, 989 [NASA ADS] [CrossRef] [Google Scholar]
- Prantzos, N., Abia, C., Limongi, M., Chieffi, A., & Cristallo, S. 2018, MNRAS, 476, 3432 [Google Scholar]
- Rauscher, T., & Thielemann, F.-K. 2000, At. Data Nucl. Data Tables, 75, 1 [Google Scholar]
- Ritter, C., Côté, B., Herwig, F., Navarro, J. F., & Fryer, C. L. 2018, ApJS, 237, 42 [NASA ADS] [CrossRef] [Google Scholar]
- Ruiter, A. J., Belczynski, K., Sim, S. A., Seitenzahl, I. R., & Kwiatkowski, D. 2014, MNRAS, 440, L101 [NASA ADS] [CrossRef] [Google Scholar]
- Ruiz-Lapuente, P., & Lucy, L. B. 1992, ApJ, 400, 127 [NASA ADS] [CrossRef] [Google Scholar]
- Seitenzahl, I. R., Cescutti, G., Röpke, F. K., Ruiter, A. J., & Pakmor, R. 2013a, A&A, 559, L5 [NASA ADS] [CrossRef] [EDP Sciences] [Google Scholar]
- Seitenzahl, I. R., Ciaraldi-Schoolmann, F., Röpke, F. K., et al. 2013b, MNRAS, 429, 1156 [NASA ADS] [CrossRef] [Google Scholar]
- Shen, K. J., & Moore, K. 2014, ApJ, 797, 46 [Google Scholar]
- Shen, K. J., Kasen, D., Miles, B. J., & Townsley, D. M. 2018, ApJ, 854, 52 [Google Scholar]
- Shigeyama, T., Nomoto, K., Yamaoka, H., & Thielemann, F. 1992, ApJ, 386, L13 [Google Scholar]
- Shingles, L. J., Sim, S. A., Kromer, M., et al. 2020, MNRAS, 492, 2029 [NASA ADS] [CrossRef] [Google Scholar]
- Sim, S. A., Röpke, F. K., Hillebrandt, W., et al. 2010, ApJ, 714, L52 [Google Scholar]
- Springel, V. 2010, MNRAS, 401, 791 [Google Scholar]
- Taubenberger, S., Hachinger, S., Pignata, G., et al. 2008, MNRAS, 385, 75 [NASA ADS] [CrossRef] [Google Scholar]
- Thielemann, F.-K., Nomoto, K., & Yokoi, K. 1986, A&A, 158, 17 [NASA ADS] [Google Scholar]
- Timmes, F. X., Woosley, S. E., & Weaver, T. A. 1995, ApJS, 98, 617 [NASA ADS] [CrossRef] [Google Scholar]
- Timmes, F. X., Brown, E. F., & Truran, J. W. 2003, ApJ, 590, L83 [Google Scholar]
- Townsley, D. M., Miles, B. J., Shen, K. J., & Kasen, D. 2019, ApJ, 878, L38 [Google Scholar]
- Travaglio, C., Hillebrandt, W., Reinecke, M., & Thielemann, F.-K. 2004, A&A, 425, 1029 [NASA ADS] [CrossRef] [EDP Sciences] [Google Scholar]
- Truran, J. W., Arnett, W. D., & Cameron, A. G. W. 1967, Can. J. Phys., 45, 2315 [NASA ADS] [CrossRef] [Google Scholar]
- Umeda, H., Nomoto, K., Yamaoka, H., & Wanajo, S. 1999, ApJ, 513, 861 [NASA ADS] [CrossRef] [Google Scholar]
- Wheeler, J. C., Sneden, C., & Truran, J. W. Jr. 1989, ARA&A, 27, 279 [NASA ADS] [CrossRef] [Google Scholar]
- Wilk, K. D., Hillier, D. J., & Dessart, L. 2020, MNRAS, 494, 2221 [NASA ADS] [CrossRef] [Google Scholar]
- Woosley, S. E., & Weaver, T. A. 1995, ApJS, 101, 181 [Google Scholar]
- Woosley, S. E., Arnett, W. D., & Clayton, D. D. 1973, ApJS, 26, 231 [NASA ADS] [CrossRef] [Google Scholar]
- Yoon, S., Langer, N., & Scheithauer, S. 2004, A&A, 425, 217 [NASA ADS] [CrossRef] [EDP Sciences] [Google Scholar]
Appendix A: Abundances tables
We list the nucleosynthesis yields of our models in Tables A.1 to A.22. They are created in the same way as in Gronow et al. (2021). The yields for the solar metallicity model are already included in Gronow et al. (2021). The stable nuclides, radioactive nuclides with lifetimes lower than 2 Gyr decayed to stability, and radioactive nuclides with longer lifetimes at time t = 100 s are listed in Table A.1 to A.11. Nucleosynthesis yields of selected radioactive nuclides at t = 100 s are given in Table A.12 to A.22. The data are only available at the CDS.
All Tables
All Figures
|
Fig. 1. Evolution of temperature (thin lines) and density (thick lines) of a shell (blue) and core (red) tracer particle of Model M10_03_1. |
| In the text | |
|
Fig. 2. Tracer particle distribution in the Tpeak − ρpeak - plane for Models M10_03 at 0.01, 0.1, 1, and 3 Z⊙; the mass fractions of 55Mn (top, a–d) and 55Co (bottom, e–h) at t = 100 s are color-coded. The shaded areas split the domain into normal freeze-out from NSE, α-rich freeze-out, and incomplete Si-burning (clockwise starting at top right) following Woosley et al. (1973) (see also Lach et al. 2020). |
| In the text | |
|
Fig. 3. Tracer particle distribution in the Tpeak − ρpeak - plane of the He detonation for Model M10_03_001 at t = 100 s. The 4He mass fraction is color-coded. The shaded areas are the same as in Fig. 2. |
| In the text | |
|
Fig. 4. Tracer particle distribution in the Tpeak − ρpeak - plane for Models M10_03_001 (left) and M10_03_3; the mass fractions of 56Ni (top) and 58Ni (bottom) at t = 100 s are color-coded with shaded areas as in Fig. 2. |
| In the text | |
|
Fig. 5. Mass of 57Ni over 56Ni mass for all models (solid lines). Models of Leung & Nomoto (2020) are added for comparison (dashed lines). The data for SN 2011fe is taken from Dimitriadis et al. (2017) (case 1) and for SN 2012cg from Graur et al. (2016). |
| In the text | |
|
Fig. 6. Elemental ratios relative to Fe compared to solar ratios for Models M08_03 (top) and M10_03 (bottom) at four different metallicities. |
| In the text | |
|
Fig. 7. Elemental ratios relative to Fe compared to solar ratios for all models, sorted by increasing metallicity from top to bottom: 0.01 Z⊙, 0.1 Z⊙, 1 Z⊙, and 3 Z⊙. |
| In the text | |
|
Fig. 8. Chemical evolution of Mn in the solar neighborhood, as predicted by OMEGA+ (lines, Sect. 5) and derived from stellar spectroscopy (dots, Battistini & Bensby 2015). All predictions include the contribution of Type Ia and CC SNe, using the massive star yields of Limongi & Chieffi (2018, LC18) and Nomoto et al. (2013, N13) for the top and bottom panels, respectively. In each panel the three blue lines show our predictions when we assume that all SNe Ia eject the yields of a given metallicity. The orange line shows our prediction when adopting our metallicity-dependent SN Ia yields. The gray line shows the metallicity-dependent case, but when SNe Ia are assumed to only eject Fe, without Mn, while CC SNe still eject both Fe and Mn. |
| In the text | |
|
Fig. 9. Predicted solar elemental distribution normalized to the solar abundances of Asplund et al. (2009). The blue bars show our chemical evolution prediction when combining the contribution of CC SNe (top: Limongi & Chieffi 2018, bottom: Nomoto et al. 2013), low- and intermediate-mass stars (Cristallo et al. 2015), and SNe Ia (using the metallicity-dependent yields from this work). The orange bands show the specific contrition of SNe Ia within the combined predicted abundances. |
| In the text | |
Current usage metrics show cumulative count of Article Views (full-text article views including HTML views, PDF and ePub downloads, according to the available data) and Abstracts Views on Vision4Press platform.
Data correspond to usage on the plateform after 2015. The current usage metrics is available 48-96 hours after online publication and is updated daily on week days.
Initial download of the metrics may take a while.