| Issue |
A&A
Volume 662, June 2022
|
|
|---|---|---|
| Article Number | A29 | |
| Number of page(s) | 16 | |
| Section | Cosmology (including clusters of galaxies) | |
| DOI | https://doi.org/10.1051/0004-6361/202038876 | |
| Published online | 06 June 2022 | |
Solitons in the dark: First approach to non-linear structure formation with fuzzy dark matter
Institute of Theoretical Astrophysics, University of Oslo, 0315 Oslo, Norway
e-mail: [email protected]
Received:
8
July
2020
Accepted:
1
January
2022
We present the results of a full cosmological simulation with the new code SCALAR, where dark matter is in the form of fuzzy dark matter (FDM), described by a light scalar field with a mass of mB = 2.5 × 10⁻²² eV and evolving according to the Schrödinger-Poisson system of equations. In comoving units, the simulation volume is 2.5 h−1 Mpc on a side, with a resolution of 20 h−1 pc at the highest refinement level. While the resulting large-scale resolution prevents us from studying the general properties of the FDM structure formation, the extremely high small-scale resolution allows a detailed analysis of the formation and evolution of central solitonic cores, which are found to leave their imprints on dark matter density profiles, resulting in shallower central densities, and on rotation curves, producing an additional circular velocity peak at small radii from the centre. Despite the limitations on the large-scale resolution, we find that the suppression of structures due to the quantum nature of the scalar field reveals indications of a shallower halo mass function in the low-mass end compared to the case of a ΛCDM simulation, in which dark matter is expected to cluster at all mass scales even if it was evolved with the same initial conditions as used for FDM. Furthermore, we verify the scaling relations characterising the solution to the Schrödinger–Poisson system for both isolated and merging haloes, and we find that they are preserved by merging processes. We characterise each FDM halo in terms of the dimensionless quantity Ξ ∝ Ehalo/Mhalo3, and we show that the core mass is tightly linked to the halo mass by the core–halo mass relation Mcore/Mhalo ∝ Ξ1/3. We also show that the core surface density of the simulated FDM haloes does not follow the scaling with the core radius, as observed for dwarf galaxies. This is a challenge for the FDM model as the sole explanation of core formation.
Key words: methods: numerical / dark matter
© ESO 2022
1. Introduction
The dynamics of the large-scale structures that are observed today is well captured by the standard model of cosmology, the ΛCDM model, in which our Universe is described in terms of ordinary matter and radiation (∼5%), cold dark matter (CDM) (∼25%), and dark energy in the form of a cosmological constant (∼70%) (Planck Collaboration VI 2018). The formation and evolution of structures in our Universe, seeded by small density inhomogeneities, has found its main driver in the dark matter component. This form of cold and pressureless medium heavily dominates the matter content of the Universe, accounting for ∼85% of the total non-relativistic matter component. The fluid description of CDM accurately describes the properties of the observed Universe at large scales, and the ΛCDM model is well constrained down to galactic scales. At galactic and subgalactic scales, the formation and evolution of structures is highly non-linear and can mainly be investigated by means of numerical simulations. Since the first studies of this type, cosmological N-body simulations (Aarseth 2003; Teyssier 2002; Springel 2005) have improved in many different aspects. Initially (Aarseth & Hoyle 1964), N-body simulations could only model the dynamics of a small group of particles interacting by nothing else but gravity, thus describing the CDM component of the Universe. Current purely cosmological N-body simulations have evolved into hydrodynamic simulations (Vogelsberger et al. 2014; Dubois et al. 2014; Schaye et al. 2015), including not only the baryonic physics, but also a large variety of astrophysical phenomena, which are required for simulating realistic galaxies. However, the ΛCDM model struggles to reproduce some basic small-scale properties of the observed Universe, and at galactic and subgalactic scales, it fails to reproduce observations accurately.
Cosmological dark matter-only simulations have found a universal density profile describing dark matter haloes of any mass and size. Density profiles of individual CDM haloes peak in their innermost region and are well fitted by a cuspy Navarro-Frenk-White (NFW) profile (Navarro et al. 1996),
![$$ \begin{aligned} \rho _{\rm NFW}(r) = \rho _0\left[\frac{r}{R_{\rm s}} \left(1 + \frac{r}{R_{\rm s}}\right)^2\right]^{-1}, \end{aligned} $$](/articles/aa/full_html/2022/06/aa38876-20/aa38876-20-eq2.gif)
where ρ0 corresponds to the central density of the dark halo. The scale radius Rs marks the transition point between a log-slope of γ ∼ −1 in the central part and a log-slope of γ ∼ −3 in the outskirts of the dark halo. However, many observations of rotation curves in dwarf galaxies have shown a preferred cored isothermal profile (Burkert 1995), with a nearly constant density within its core radius (Moore 1994; Flores & Primack 1994; Gentile et al. 2004; Donato et al. 2009; de Blok 2010).
In addition, due to the cold and collisionless nature of CDM, dark matter clumps exist at all scales. Dark haloes are populated by substructures of any size that are also known as subhaloes. The presence of these subhaloes was soon verified by the first numerical simulations, but the count of the number of substructures far exceeds the number of subhaloes found in the Local Volume (Klypin et al. 1999; Moore et al. 1999). The number of subhaloes of a galaxy such as the Milky Way is roughly one order of magnitude smaller than predicted by the ΛCDM model.
Furthermore, several studies have shown that the process of star formation is very sensitive to astrophysical and environmental processes, and it can be highly stochastic in low-mass haloes. However, many substructures predicted by the ΛCDM model are simply too massive to have failed star formation. This is an additional source of discrepancy (Boylan-Kolchin et al. 2011, 2012).
Moreover, in spite of the wide diversity of structures found in the Universe, astronomical observations suggest a tight connection between the dynamical and baryonic properties of galaxies. These scaling relations still represent a great challenge for the ΛCDM model at small scales. An example is the baryonic Tully–Fisher relation (BTFR), which links the total baryonic mass of a galaxy with its asymptotic circular velocity (McGaugh et al. 2000). While within the ΛCDM model the latter scales as  with baryonic mass, the observed trend suggests a scaling of
  . In general, despite the enormous improvement in numerical techniques and astrophysical models, it is still difficult to reproduce all scaling relations at once.
It is currently still unclear where the discrepancies between theoretical predictions of numerical simulations and astronomical observations at small scales originate. On one hand, dark matter cannot be as cold and collisionless as previously thought, but its true nature remains unknown. On the other hand, small-scale baryonic astrophysical processes might very well resolve these differences (Governato et al. 2012; Brooks et al. 2013; González-Samaniego et al. 2017), but their dynamics is extremely complex, and hydrodynamic simulations might not capture all the relevant physics involved in small-scale astrophysical phenomena.
Today, weakly interactive massive particles (WIMPs) are still considered by many to be one of the most likely dark matter candidates. Without any success so far, many ongoing experiments are trying to detect such particles, but the unprobed region of the parameter space is about to reach the neutrino floor. Beyond the neutrino floor, it would be impossible to observe any signature left by WIMPs, as the signal would be drowned in the solar neutrino background.
This motivates the search for alternative dark matter candidates. Current models involving ultra-light scalars, such as ultra-light axions (ULAs) and fuzzy dark matter (FDM), are among the most promising alternatives to WIMPs (see e.g. Dine & Fischler 1983; Preskill et al. 1983; Lee & Koh 1996; Peebles 2000; Hu et al. 2000; Marsh 2016; Hui et al. 2017). This class of models is very appealing, and the models gained much attention in the past decade. Not only do they predict distinct and observable signatures at small scales, but they can alleviate the differences between theoretical predictions of the ΛCDM model and astronomical observations. The dynamics of FDM and ULAs is described by the classical Schrödinger equation. Recently, an exiguous number of numerical tools where developed to study the dynamics of this class of models, and the first numerical simulations were performed.
Traditionally, two main categories of numerical algorithms have been developed for this purpose. The Madelung formulation of quantum mechanics (Madelung 1926) defines a system of hydrodynamic equations in which the quantum nature of a collection of extremely light bosons is encoded in a pressure-like term, called quantum pressure. On scales below the boson de Broglie wavelength, quantum pressure prevents the collapse of dark matter particles by counteracting gravity. The Madelung equations can be used to model the physics of ULAs and FDM in particle-based fluid simulations. In this case, different numerical schemes have been designed in order to discretise the quantum pressure, and the Madelung equations are solved by means of traditional smoothed particle hydrodynamics (SPH), as suggested by Marsh (2015). For example, by using a particle-based approach, Zhang et al. (2018) and Nori & Baldi (2018, 2021) successfully reproduced the expected density profiles of dark haloes. Although they are faster than other algorithms implemented in grid-based codes, the hydrodynamic approach can lack accuracy. The Madelung formulation is known to break down in extremely low-density regions, such as voids and interference nodes, as the quantum pressure can develop singularities (Uhlemann et al. 2014).
Alternatively, the dynamics of the ULAs and FDM can be described by solving the Schrödinger-Poisson system in a grid-based approach. In this case, the wave function is discretised on a grid and the non-linear Schrödinger equation can be solved using different techniques. For example, several grid-based codes implement spectral methods, and they solve the governing equations in Fourier space (Woo & Chiueh 2009; Mocz et al. 2017, 2020; Edwards et al. 2018). Other grid-based codes employ a Taylor method to discretise the time-evolution operator in order to compute the formal solution of the non-linear Schrödinger equation (Schive et al. 2014a; Li et al. 2019; Mina et al. 2020). The general evolution of a Universe with FDM was initially investigated in Woo & Chiueh (2009), while the first high-resolution cosmological simulation with FDM was performed in Schive et al. (2014a), who studied the behaviour of the FDM fluid within dark haloes. Mocz et al. (2017, 2020) instead simulated the formation and evolution of galaxies and dark haloes with the Bose-Einstein condensate dark matter (BECDM) model.
The Schrödinger-Poisson system has also been introduced as an alternative tool for sampling the six-dimensional phase-space of a system of collisionless self-gravitating particles (Widrow & Kaiser 1993). In this regard, Kopp et al. (2017) and Mocz et al. (2018) showed that it is possible to recover the classical behaviour in the limit of ℏ → 0, with excellent agreement with the solution of the standard Vlasov equations. Although grid-based numerical methods are very accurate, they are also slower than particle-based codes. For this reason, only two-dimensional applications were considered in some of these works, as full three-dimensional applications were too expensive in terms of computational resources.
Although they agree qualitatively, different numerical studies have reached different quantitative conclusions. In particular, the core and halo masses are expected to be tightly linked by the core–halo mass relation, but the scaling between the two is found to be different in almost every numerical study of structure formation involving ULAs and FDM (Schive et al. 2014a,b; Schwabe et al. 2016; Mocz et al. 2017, 2018). These differences can be attributed to many factors, including numerical algorithms. An exhaustive benchmark study of different numerical tools is still lacking, but it is important to test and verify the dynamics of ultra-light scalar fields with different codes in order to reach a quantitative agreement on the theoretical predictions of this class of models.
In this paper we present a high-resolution cosmological simulation of a Universe in which the entire budget of dark matter is in the form of FDM. The simulation is performed by using the Simulation Code for ultrA Light Axions in RAMSES (SCALAR) code. The purpose of this work is to investigate and characterise the dynamics of dark matter haloes within the paradigm of FDM, together with the formation and evolution of their central solitonic cores, which are a key signature of models based on ultra-light scalar fields. The study of the formation and evolution of these cores is essential for testing the model against observations. For example, a soliton core is found to fit the cores observed in some dwarf galaxies very well, which in turn were used to constrain or even determine the mass of the light boson, assuming that the formation mechanism of these cores is solely due to the phenomenology of ULAs or FDM (Schive et al. 2014a; Marsh & Pop 2015; Calabrese & Spergel 2016; González-Morales et al. 2017; Bozek et al. 2015). On the other hand, Burkert (2020) recently argued that the dark matter cores previously predicted by cosmological simulations involving this class of models are inconsistent with observations if FDM dark haloes form following the classical hierarchical paradigm.
The structure of the paper is as follows: in Sect. 2 we describe the theory behind the class of dark matter models involving light scalar fields, and in Sect. 3 we introduce the simulation andbriefly describe the numerical methods we used to solve the Schrödinger-Poisson system. Then, we present the results of the simulation in Sect. 4 and the results of our convergence tests in Sect. 5 before we conclude in Sect. 6.
2. Theory
In this section we summarise the phenomenology and the dynamics of light scalar fields in a general context, without introducing any specific model motivated by particle physics. Then, starting from the phenomenology of a light scalar field, we describe them in cosmological context, derive the governing equations, and briefly describe their dynamics. The equations are given in natural units, where c = ℏ = 1.
2.1. Scalar fields as dark matter
A complex scalar field has an internal global U(1) symmetry that is spontaneously broken when it acquires a vacuum expectation value. Thus the two components of the complex scalar field are reconfigured in a massive mode and a Goldstone boson. The Goldstone boson is a massless angular degree of freedom, which is invariant under shift transformations. However, at some energy scale, non-perturbative physics becomes relevant, and it explicitly breaks the shift symmetry, leading to a preferred field configuration and, thus, a potential for the Goldstone boson. The potential must respect the residual discrete shift symmetry because the Goldstone boson still represents an angular degree of freedom, and it must therefore be periodic. By denoting with ϕ the Goldstone boson, with fϕ the energy scale of the spontaneous symmetry breaking, and with Λϕ the energy scale at which non-perturbative effects become relevant, the potential can generally be written as  , where U(ϕ/fϕ) is periodic. Although the explicit form of the potential depends on the underlying model, one of its simplest forms is
![$$ \begin{aligned} V(\phi ) = \Lambda _{\phi }^4 \left[1-\cos \left(\frac{\phi }{f_{\phi }}\right)\right]. \end{aligned} $$](/articles/aa/full_html/2022/06/aa38876-20/aa38876-20-eq6.gif)
In order to study the dynamics of ϕ in a model-independent way, we only consider small displacements of the field from the minimum of the potential. Thus, the potential can be expressed as a Taylor series. The leading term of the Taylor expansion is the mass term, and the potential can be approximated as follows:

where  corresponds to the mass of the boson. Higher-order contributions to the Taylor expansion of the potential would include terms describing self-interactions and interactions with other standard model fields. However, those terms are suppressed by higher powers of fϕ, and we do not consider them, as they are not relevant for this work. Typically, the parameter fϕ lies in between the traditional energy scale of the grand unification theory EGUT ∼ 1016 GeV and the Plank energy EPl ∼ 1018 GeV. Again, the energy scale of non-perturbative physics is extremely sensitive to the details of the underlying model and is not relevant for this work.
The only relevant assumption in the context of dark matter cosmology revolves around the boson mass. Typical FDM models consider a scalar field with a mass in the range of 10−24 < mB < 10−22 eV, which is of particular interest for current observations (see e.g Marsh & Ferreira 2010; Marsh & Pop 2015; Calabrese & Spergel 2016; González-Morales et al. 2017; Bar et al. 2019a). Because their mass is extremely low, FDM particles manifest their wave nature on astronomical scales. While large-scale predictions would essentially be the same as for the ΛCDM model, the quantum nature of the dark matter fluid would suppress the formation of structure at small scales, providing a natural solution to the small-scale problems of the ΛCDM model (Marsh & Pop 2015; Hui et al. 2017). The corresponding de Broglie wavelength of FDM particles,
is far larger than the mean inter-particle separation. Under these circumstances, FDM particles have a high ground-state occupation number and form a Bose-Einstein condensate (BEC). As a consequence, the system behaves as a macroscopic quantum state, and it can be described by a single wave-function evolving according to the classical Schrödinger equation.
2.2. Fuzzy dark matter
In general relativity (GR), a spin-0 real scalar field minimally coupled with the metric is described by the action
![$$ \begin{aligned} S_{\phi } = \int \mathrm{d}^4 x \sqrt{-g} \left[\frac{1}{2} {g}^{\mu \nu } \partial _{\mu }\phi \partial _{\nu } \phi - V(\phi ) \right]. \end{aligned} $$](/articles/aa/full_html/2022/06/aa38876-20/aa38876-20-eq10.gif)
This action is only valid after the symmetry is spontaneously broken and once non-perturbative effects are switched on. The equation of motion of the field can be obtained by varying the action with respect to the field itself, and it is in the form of the Klein-Gordon equation,
![$$ \begin{aligned} \frac{1}{\sqrt{-g}} \partial _{\mu } \left[\sqrt{-g} \; {g}^{\mu \nu } \partial _{\nu } \phi \right] - \frac{\partial V}{\partial \phi } = 0. \end{aligned} $$](/articles/aa/full_html/2022/06/aa38876-20/aa38876-20-eq11.gif)
The corresponding energy-momentum tensor can instead be derived by varying the action with respect to the metric,
![$$ \begin{aligned} {T}{^\mu _\nu } = {g}^{\mu \alpha } {\partial }{_\alpha } \phi {\partial }{_\nu } \phi - \frac{{\delta }{^\mu _\nu }}{2} \left[{g}^{\alpha \beta } {\partial }{_\alpha }\phi {\partial }{_\beta }\phi + V(\phi )\right]. \end{aligned} $$](/articles/aa/full_html/2022/06/aa38876-20/aa38876-20-eq12.gif)
Background evolution. The background evolution of the field can be studied under the assumption of homogeneity and isotropy. When the d’Alembert operator is computed for the Friedman-Robertson-Walker (FRW) metric and the potential is replaced with its Taylor expansion up to the leading order, the equation of motion of the field for this purpose reduces to

where H denotes the Hubble expansion rate. This equation corresponds to a simple harmonic oscillator, with a time-dependent friction term determined by the underlying background cosmology. The damping ratio of the system can be defined as

where ω0 = mB corresponds to the natural frequency of the system. The behaviour of the system can be characterised by two regimes. At early stages, the mass term is completely negligible compared to the Hubble term. In this regime, we can therefore disregard the mass term, and Eq. (8) describes an overdumped harmonic oscillator, as ζ ≫ 1. In this case, the value of the field remains frozen to its initial value. However, as the Hubble rate drops as H ∼ t−1, the damping ratio decreases, and at t = tosc, the condition ζ = 1 defines the crossover between the overdumped regime and a new regime in which the field starts to oscillate coherently. In the limit of ζ ≪ 1, we can neglect the friction term in Eq. (8), and the system is described by an underdumped harmonic oscillator. In particular, when the Universe is matter dominated, the scale factor evolves as a ∝ tp and the exact solution of Eq. (8) reads
![$$ \begin{aligned} \phi (a) = a^{-3/2} (t/t_{\rm ini})^{1/2} \left[C_1 J_n(m_{\rm B}t) + C_2 Y_n(m_{\rm B}t)\right], \end{aligned} $$](/articles/aa/full_html/2022/06/aa38876-20/aa38876-20-eq15.gif)
where n = (3p − 1)/2, Jn(x) and Yn(x) are Bessel function of the first and the second kind, respectively, and tini is the initial time. In order to better understand the behaviour of the field, we can define its background energy density and pressure as follows:
![$$ \begin{aligned} \rho _{\rm B}&= \frac{1}{2} \left[\left(\frac{\mathrm{d}\phi }{\mathrm{d}t}\right)^2 + m_{\rm B}^2 \phi ^2\right], \end{aligned} $$](/articles/aa/full_html/2022/06/aa38876-20/aa38876-20-eq16.gif)
![$$ \begin{aligned} p_{\rm B}&= \frac{1}{2} \left[\left(\frac{\mathrm{d}\phi }{\mathrm{d}t}\right)^2 - m_{\rm B}^2 \phi ^2 \right]\cdot \end{aligned} $$](/articles/aa/full_html/2022/06/aa38876-20/aa38876-20-eq17.gif)
In the overdumped regime, the first term between parentheses in both Eqs. (11) and (12) is negligible, and the field has an effective equation of state wB = pB/ρB = −1. As a consequence, at early stages, the field effectively behaves as a dark energy component. On the other hand, by plugging Eq. (10) into Eqs. (11) and (12), it is possible to show that in the underdamped regime, the equation of state is the same as any non-relativistic component (e.g. CDM) and the background energy density evolves as ρ ∝ a−3. As long as the crossover ζ = 1 occurs before the matter-radiation equality, this type of models is suitable as alternative dark matter models. In the ΛCDM model, the Hubble rate at matter-radiation equality is roughly H(aeq)∼1028 eV. This poses a lower bound to the boson mass: models involving a scalar field with a mass higher than ∼1028 eV represent a potential dark matter candidate.
As a consequence, assuming that the transition between the two regimes takes place within the radiation-dominated epoch, the present-day relic abundance of FDM can be written as
Non-linear dynamics. In the context of cosmological structure formation, we focus on the underdamped regime and assume throughout the remaining paper that the whole dark matter budget of the Universe is in the form of FDM. In order to study the growth of perturbations in an FDM Universe, we consider a perturbed FRW metric instead in the Newtonian gauge. In the weak-field limit, the metric tensor is therefore given by

where Φ denotes the Newtonian gravitational potential. Plugging the non-zero components of the metric tensor in the Klein-Gordon equation, Eq. (6), leads to

Instead, plugging the non-zero components of the metric tensor in the “00” component of the energy-momentum tensor, Eq. (7), gives the energy density of the field,
![$$ \begin{aligned} \rho _{\rm B} = \frac{1}{2} \left[\left(1+2\Phi \right) \frac{\partial \phi }{\partial t} + m_{\rm B}\phi ^2 + \frac{\left(1-2\Phi \right)}{a^2} \partial ^i \phi \partial _i \phi \right]. \end{aligned} $$](/articles/aa/full_html/2022/06/aa38876-20/aa38876-20-eq21.gif)
However, since rapid temporal fluctuations of the density of the field do not contribute at all to the gravitational potential, we can explicitly disregard the high-frequency part of the spectrum by considering the non-relativistic limit. For this purpose, we express ϕ in terms of a complex scalar field ψ,

thus filtering out the contribution of high-frequency modes, that is, ω ∼ mB. As a consequence, we can safely assume that  , and the equation of motion for the complex scalar field ψ reduces to

Equation (18) corresponds to a non-linear Schrödinger equation, generalised to the case of an expanding Universe. Furthermore, in the non-relativistic limit, the leading term in the energy density of the field, Eq. (16), corresponds to

In order to study the non-linear clustering of dark matter in a cosmological context, Eq. (18) is coupled to the Poisson equation, which reads under the previous assumptions
and it describes the reaction of the gravitational potential to fluctuations in the density field.
It is also possible to recast the Schrödinger equation in a system of hydrodynamic equations. In this case, we express the wave-function ψ in polar coordinates,

and we describe the behaviour of the dark matter fluid in terms of the macroscopic quantities


When we replace the previous definitions into the Schrödinger equation and consider the real and imaginary parts separately, the dynamics of the macroscopic fluid follows the system of equations


Here, the term Q is the so-called quantum potential, and it is defined as
Equations (24) and (25) correspond to the Madelung formulation of quantum mechanics. Density and velocity now assume a classical meaning. While equation Eq. (24) is the same as the classical continuity equation and describes the conservation of mass, the Euler-like equation Eq. (25) expresses the conservation of momentum. In contrast to its classical counterpart, Eq. (25) does not have a classical pressure term. However, the term Q is equivalent to a pressure term, generating a certain stiffness in the field, which in turn resists the compression due to gravity. The quantum pressure only acts in certain regions of the Universe. In particular, when the density field tends to zero, the term Q vanishes. As a consequence, when the quantum potential is absent or negligible, Eqs. (24) and (25) describe a system of particles that only interact by means of gravity, and they have the same form as the CDM fluid equations. In the cosmological context, the quantum pressure is expected to be high in extremely high-density regions, such as the innermost part of a dark matter halo, and on scales of the de Broglie wavelength of dark matter particles, but everywhere else, the fields behave as in the classical CDM.
3. Simulation
In this section we summarise the numerical setup we adopted for our simulation and the steps involved when computing the initial conditions. In addition, we highlight the main numerical schemes used by SCALAR in order to solve the governing equations of FDM.
3.1. Numerical setup
For this work, we simulated a Universe in which the whole dark matter budget was in the form of FDM. For this purpose, we employed the new adaptive mesh refinement (AMR) code SCALAR to evolve a scalar field with a mass of mB = 2.5 × 10⁻²² eV, in a cosmology with present-day matter and dark energy density parameters of ΩFDM = 0.3 and ΩΛ = 0.7, respectively, a dimensionless Hubble constant of h = 0.67, and a linear power spectrum normalisation of σ8 = 0.8. The simulation volume of 2.5 h−1 Mpc on a side was discretised with 5123 cells at the domain grid, and with up to eight refinement levels. In this simulation, the maximum density allowed at the domain grid corresponded to ρ/ρc = 10, and each cell in the AMR grid was refined every time the density exceeded ten times the maximum density of the current AMR grid. Thus, while the resolution of the domain grid was limited to Δx ∼ 5 h−1 kpc, the effective resolution of our simulation was approximately Δx ∼ 20 h−1 pc. According to Eq. (4), if we consider the typical circular velocity profile in the innermost part of an average dark matter halo, quantum effects are expected appear on scales of roughly 1 h−1 kpc. Thus, the extremely high resolution is enough to capture the behaviour of the field in high-density regions dominated by quantum effects. The initial linear power spectrum was computed with the publicly available code1AxionCAMB (Hlozek et al. 2015) and was used to construct the initial conditions for the scalar field at redshift z = 200 (see Appendix A for thegeneration of the initial conditions). The Universe was then evolved until redshift z = 2.5. We did not run the simulation further because the computational time required for running the simulation until the present day was too long and was not required for the purpose of this paper. The same initial conditions, generated with a truncated initial power spectrum, were used to simulate a ΛCDM Universe with the same cosmology using the RAMSES code.
3.2. Numerical schemes
In SCALAR, the solution of the non-linear Schrödinger equation is discretised on an AMR grid, where finer resolutions are only employed in regions in which features of the wave-function are more demanding. Provided the wave-function at time tn, the formal solution of the non-linear Schrödinger equation at tn + 1 = tn + Δt reads

The propagator U(tn + 1,tn), also known as the time-evolution operator, links the wave-function at different times and is discretised as follows:
![$$ \begin{aligned} U \left(t_{n+1}, t_n \right) = \exp \left[-i \hat{H} \left(\boldsymbol{x}, t_n \right) \Delta t \right], \end{aligned} $$](/articles/aa/full_html/2022/06/aa38876-20/aa38876-20-eq34.gif)
where  denotes the Hamiltonian of the system. The Lie-Trotter formula is used to split kinetic and potential terms in the Hamiltonian, which are denoted by
  and
and  , respectively. Thus, the solution of the non-linear Schrödinger equation at time tn + 1 is computed as
![$$ \begin{aligned} \psi \left(\boldsymbol{x}, t_{n+1} \right) = \exp \left[-i \hat{W} \left(\boldsymbol{x}, t_n \right) \Delta t \right] \exp \left[-i \hat{K} \left(\boldsymbol{x}, t_n \right) \Delta t \right] \psi \left(\boldsymbol{x}, t_{n} \right). \end{aligned} $$](/articles/aa/full_html/2022/06/aa38876-20/aa38876-20-eq38.gif)
First, the term involving the free kinetic part of the Hamiltonian is expanded in Taylor series and is applied to the wave-function as follows:
![$$ \begin{aligned} \bar{\psi } \left(\boldsymbol{x}, t_{n+1}\right) = \left[1 + \left(\frac{i \Delta t}{2 m_{\rm B}} \nabla ^2\right) + \frac{1}{2} \left(\frac{i \Delta t}{2 m_{\rm B}} \nabla ^2\right)^2 + \ldots \right] \psi \left(\boldsymbol{x}, t_{n}\right). \end{aligned} $$](/articles/aa/full_html/2022/06/aa38876-20/aa38876-20-eq39.gif)
Here, the Laplacian is computed by using the standard second-order finite difference formula. Furthermore, in Eq. (30), SCALAR only considers terms up to 𝒪(dt3). Then, the phase rotation induced by the potential is calculated and the wave-function at time tn + 1 is computed as
![$$ \begin{aligned} \psi \left(\boldsymbol{x}, t_{n+1}\right) = \exp \left[-i m_{\rm B} \Phi \left(\boldsymbol{x}, t_n\right) \Delta t \right] \bar{\psi } \left(\boldsymbol{x}, t_{n+1}\right). \end{aligned} $$](/articles/aa/full_html/2022/06/aa38876-20/aa38876-20-eq40.gif)
In order to ensure good conservation properties, SCALAR can employ a secondary solver. For this purpose, density currents j between AMR cells are computed at cell interfaces and at half time-step. Then, the associated continuity equation is solved on top of the non-linear Schrödinger equation as
![$$ \begin{aligned} \rho \left(\boldsymbol{x},t_{n+1}\right) = \rho \left(\boldsymbol{x},t_{n}\right) - \frac{\Delta t}{\Delta x} \left[\boldsymbol{j} \left(\boldsymbol{x}_{i+1/2},t_{n+1/2}\right) - \boldsymbol{j} \left(\boldsymbol{x}_{i-1/2},t_{n+1/2}\right)\right]. \end{aligned} $$](/articles/aa/full_html/2022/06/aa38876-20/aa38876-20-eq41.gif)
The new dark matter density is used to rescale the wave-function that was previously advanced by the Schrödinger solver. This process ensures a good level of mass conservation, which is needed for cosmological simulations.
The algorithm used by SCALAR to solve the Poisson equation is instead the same as the algorithm that was originally implemented in the RAMSES code. At the domain level, the gravitational potential is computed in Fourier space by using a spectral solver. At finer levels of the AMR hierarchy, SCALAR switches to its multi-grid solver, which determines the solution of the Poisson equation by using a successive over relaxation (SOR) scheme. We refer to the original papers of Mina et al. (2020) and Teyssier (2002) for further details about the implementation of numerical schemes.
4. Results
In this section we present the results of our simulation. The analysis was partially made with a modified version of the YT python package (Turk et al. 2011), and the halo catalogues were computed using the Amiga halo finder (Knollmann & Knebe 2009). A virial overdensity Δvir = 200 was used when haloes were located.
4.1. General evolution of an FDM Universe
In Fig. 1 we project the FDM density field along the line of sight, normalised by the critical density of the Universe. The two-point correlation function of matter density perturbations is described by the matter power spectrum. By considering the Fourier transform of the density contrast,

 |
Fig. 1. Projection along the z-axes of the dark matter density field, normalised by the critical density of the Universe. The box is 2.5 Mpc h−1 in comoving units, and it represents the entire simulation box. |
the power spectrum P(k) can be defined in terms of the autocorrelation function,

or, alternatively, in its dimensionless form,

For k ≪ 1 h−1 Mpc the power spectrum probes modes in the density field that are still in the linear regime, thus describing the large-scale structure of the Universe. On the other hand, at k ≫ 1 h−1 Mpc, the power spectrum encodes information about the evolution of the Universe at galactic and subgalactic scales, evolving in the non-linear regime.
Because of the quantum nature of the scalar field, the FDM model predicts a sharper cutoff on non-linear scales than the ΛCDM model. The quantum pressure generated in high-density regions and on scales of the de Broglie wavelength suppresses the formation of structures above the corresponding Jeans wavenumber, which can be estimated by linear theory as (Marsh 2016)
where ΩFDM corresponds to the present-day dark matter relic abundance. Thus, the redshift dependent comoving Jeans wavelength λJ = 2π/kJ is given by

In contrast to the CDM case, the presence of the Jeans wavelength in the FDM model is directly connected to the quantum pressure. As a consequence, below scales comparable to the Jeans wavelength, structure formation is heavily suppressed. Thus, the corresponding Jeans mass can be defined as follows:

When we assume that the solitonic core extends to the virial radius of the dark halo, Eq. (38) provides a lower bound on the mass of FDM haloes.
4.2. Dark halo growing in an FDM Universe
In our simulation, the first structures start forming around redshift z ∼ 10. In Fig. 2 we present the dark matter field, normalised by the critical density of the Universe, and we show how it evolves as it forms one of the first structures. Starting from a small clump in form of a filament, dark matter is increasingly accreted towards the deepest point of the gravitational potential well. As the system evolves towards a coherent state, the macroscopic wave-function develops the first interference fringes, revealing the quantum nature of the dark matter fluid for the first time. In the region around the minima of the gravitational potential, density grows over time, forming a small gravitationally bound structure: the first FDM halo. At the same time, on scales comparable with the de Broglie wavelength of the scalar field, the quantum pressure builds up as the scalar field collapses further, pushing energy from the highest-density region of the dark halo to its outskirts. A coherent and stable configuration develops in the innermost region of the collapsed object, forming a soliton with nearly constant density at the centre. Outside the soliton radius, the field acquires its typical granular structure, which significantly differs from the classical CDM halo. These small coarse-grained clumps originate in the superposition of multiple plane-waves, resulting from the flow of energy promoted by the quantum pressure.
 |
Fig. 2. Slice along the z-axis across one of the first structures that formed in our simulation box. Each panel represents a slice of 200 h−1 kpc on a side in comoving units. The density is normalised by the critical density of the Universe. |
For illustrative purposes, we followed the evolution of a single FDM halo during the expansion of the Universe. To do this, we selected an isolated halo, called HALO 2, from the most massive haloes that formed in our simulation. As shown in Fig. 3, we tracked its density profile as the scalar field collapsed under the effect of gravity. Because of the quantum nature of the scalar field, the innermost region of the dark halo exhibits a solitonic core with an almost constant density at all redshifts, which characterises the soliton solution of the non-linear Schrödinger equation. The solitonic core extends on scales corresponding to the coherence length of the scalar field, or its de Broglie wavelength. On larger scales, where no high level of coherence is achieved, the density profile quickly drops as a power law.
 |
Fig. 3. Comoving density (left panel) and circular velocity (right panel) profiles of HALO 2 at redshifts z = 5.0, 4.6, 4.2, 3.6, 2.8, and 2.5. At these redshifts, HALO 2 is characterised by a mass of Mz = 5.0 = 1.71 × 10⁸ M⊙, Mz = 4.6 = 3.44 × 10⁸ M⊙, Mz = 4.2 = 5.73 × 10⁸ M⊙, Mz = 3.6 = 9.73 × 10⁸ M⊙, Mz = 2.8 = 2.09 × 10⁹ M⊙, and Mz = 2.5 = 2.25 × 10⁹ M⊙. |
In Fig. 4 we only consider HALO 2 at redshift z = 2.5. In the upper panel, we fit the innermost region of its density profile with the soliton profile,
![$$ \begin{aligned} \rho (r) = 1.9 \times 10^9\,h\,a^{-1} \frac{\left(\dfrac{m_{\rm B}}{10^{-23}\,\mathrm{eV}}\right)^{-2} \left(\dfrac{R_{\rm core}}{\mathrm{kpc}\,h^{-1}}\right)^{-4}}{\left[1+9.1\times 10^{-2}\left(\dfrac{r}{R_{\rm core}}\right)^{2}\right]^8}\; \frac{M_{\odot }}{({\mathrm{kpc}\,h^{-1}})^3}, \end{aligned} $$](/articles/aa/full_html/2022/06/aa38876-20/aa38876-20-eq48.gif)
 |
Fig. 4. Density (upper panel) and circular velocity (bottom panel) profiles of HALO 2 at redshift z = 2.5. The solid lines show the FDM (green) and the CDM (blue) haloes. While the dotted green line represents result of the fit of the solitonic core found in the FDM halo, the dotted blue line represents the result of the NFW fit of the CDM halo. |
leaving the core radius as the only free parameter. This formula was first suggested by Schive et al. (2014a) and defines the core radius as the point at which the density drops by half its central value. In this case, the solitonic core is well fitted by Eq. (39) with a core radius of Rcore = 0.35 h−1 kpc, in comoving units. At the same time, we fit the density profile at larger radial distances with the NFW profile given by Eq. (1). In this case, the free parameters of the fit are the central density ρ0 and the concentration of the halo, defined as cNFW = Rvir/Rs. When the same virial radius found for the FDM halo is assumed, the best fit yields an NFW profile characterised by a comoving central density of ρ0 = 4.26 × 10⁶ M⊙ (h−1 kpc)−3 and a concentration parameter of cNFW = 10.08. In the bottom panel of Fig. 4, we instead plot the circular velocity of the FDM halo, which is computed according to the formula:

where G denotes the Newton gravitational constant, and Menc corresponds to the mass enclosed within the radius r.
By redshift z = 2.5, the ΛCDM Universe simulated on a side has produced more structures and substructures because low-mass halo formation is suppressed within the FDM model. This makes a direct match between FDM and CDM hard. For this reason, we selected a dark halo in the simulated ΛCDM Universe with virial properties (Mvir = 1.78 × 10⁹ M⊙, Rvir = 28.64 h−1 kpc, and cNFW = 2.82) similar to HALO 2. In Fig. 4 we plot its density profile and rotation curve. The circular velocity profile of the CDM halo is characterised by a single peak located at Rmax = (α/cNFW)Rhalo, with α ∼ 2.16. In the case of the FDM halo, the circular velocity peak is instead located at much smaller radii than the CDM halo because a small compact and prominent solitonic core lies at the centre of the dark halo. In other cases, the circular velocity profiles of FDM haloes exhibit two peaks, one connected to the solitonic core at the centre, and the other connected to the NFW-like outer region contribution, as discussed in Sect. 4.3. In some cases, the presence of such a solitonic core can be disfavoured if circular velocity profiles are compared with real observed dwarfs (Bar et al. 2018, 2019b). Finally, at redshift z = 2.5, HALO 2 has a virial mass and a comoving virial radius of Mvir = 1.56 × 10⁹ M⊙ and Rvir = 24.21 h−1 kpc, respectively.
4.3. Non-linear regime at low redshift
At redshift z = 2.5, we selected a sample of five representative haloes found in our simulation box, spanning over three dex in virial mass. The density profiles of the five haloes are plotted in the left panel of Fig. 5, and in the right panel, we plot their rotation curves computed according to Eq. (40). By using the soliton profile, Eq. (39), we fit the innermost region of the density profiles, estimating the core radius of each halo in this way. Except for some scatter beyond the soliton radius due the complex dynamics, the outer part of each FDM halo decays in a similar way to the classical CDM halo, following an NFW profile. The transition between the soliton profile and the NFW outskirts is found to universally occur at a radius of r ∼ 3 Rcore. Typically, high-mass FDM haloes are characterised by more prominent solitonic cores, with higher core masses and smaller core radii than low-mass FDM haloes. This reflects the core mass–radius and core–halo mass scaling relations, which are investigated in detail in Sect. 4.4.
 |
Fig. 5. Dark matter density profiles (left panel) and rotation curves (right panel) of a representative sample of five FDM haloes found at redshift z = 2.5. The density of each individual halo is expressed in units of its central density. Similarly, the radial distance is normalised to the core radius of each individual halo. In both panels, the vertical dashed line corresponds to r = 3 Rcore, marking the point where the solitonic profile breaks. The masses of the haloes shown in this figure are M1 = 6.52 × 10⁹ M⊙, M2 = 1.55 × 10⁹ M⊙, M3 = 2.25 × 10⁹ M⊙, M4 = 2.30 × 10⁸ M⊙, and M5 = 8.46 × 10⁷ M⊙. |
By computing the moment of intertia tensor, we can estimate the shapes of the FDM haloes, which can have important observational consequences. In contrast to the results obtained in Mocz et al. (2020) for the case of BECDM, where dark haloes were found to be more triaxial than typical CDM haloes, we find that FDM haloes follow the characteristic triaxial configuration of CDM haloes, with axis ratios of b/a ∼ c/a ∼ 0.55 − 0.85.
In addition, for both the FDM and the CDM simulations, we computed the halo mass function (HMF) by counting the number of structures falling in a given mass bin. Because the size of the box is small, we can only probe mass scales up to M ≲ 1010 M⊙, corresponding to typical dwarf masses. In Fig. 6 we compare the two HMFs with the ΛCDM estimate provided by Tinker et al. (2008). First, we note that the smallest haloes in the simulated FDM Universe at redshift z = 2.5 have a virial mass of 7.14 × 10⁶ M⊙, which is consistent with the minimum mass estimate provided by Eq. (38). Then, we note that the HMF of the simulated FDM Universe is suppressed at all mass scales. In the CDM run, the HMF also shows signs of suppression at masses Mhalo ≲ 109 M⊙, but this is an artificial effect because we also employed the FDM initial conditions for the CDM run (the initial linear power spectrum is suppressed at small scales). However, below Mhalo ≲ 108 M⊙, the HMF computed for the CDM run exhibits the same trend as expected for the ΛCDM model, growing as

 |
Fig. 6. Halo mass function computed for the FDM and CDM simulations. The solid black line corresponds to the analytical estimate of the HMF in a ΛCDM cosmology at z = 2.5, based on Tinker et al. (2008). |
The stellar mass function (SMF) measured for observed galaxies is also suppressed at typical mass scales of dwarf galaxies. In this case, the observed suppression is attributed to various feedback mechanisms dominating in low-mass and dark matter-dominated systems, resulting in strong star formation inefficiencies. Within the ΛCDM model, this large difference between the HMF and the SMF is at the origin the missing satellite and too-big-to-fail (Boylan-Kolchin et al. 2011) problems. In the case of an FDM Universe, the suppression of the HMF above Mhalo ∼ 108 M⊙ can probably be attributed to the lack of statistics, but the suppression found in the low-mass end is a direct consequence of the quantum nature of the scalar field and clearly shows the capability of this model to work in the right direction to solve the aforementioned small-scale problems. As found in previous numerical investigations (e.g. Schive et al. 2016), the increasing trend found in the HMF towards low masses can reflect the formation of spurious haloes. These numerical artefacts are extremely difficult to identify, especially in grid-based simulations, but we do not expect them to have an impact on the other probes we investigate here.
Furthermore, the existence of a circular velocity peak due to a small compact core, shown in Figs. 4 and 5, can have strong consequences for the FDM model (Bar et al. 2018). If baryonic physics were included in the treatment, small compact solitonic cores might in principle enhance gravitational cooling and accretion of gas towards the centre of dark matter haloes in systems with virial masses above a critical mass of Mhalo ≳ 108 M⊙. As suggested by Schive et al. (2014b), formation of ultra-dense gas in the centre of the dark halo could promote major starburst and early forming quasars (Mortlock et al. 2011). On the other hand, because of the bursty star formation that is observed in dwarf galaxies, stellar feedback often prevents gas accretion, leading to a complex interplay between gravitational cooling and heating processes resulting from various feedback mechanisms. Baryonic processes are known to be very strong even in dark matter-dominated systems, such as dwarf galaxies, and therefore we cannot draw any conclusion based on the results obtained from our simulated FDM Universe alone. We reserve a proper numerical investigation including baryonic physics for a future work, as well as relevant astrophysical processes such as stellar feedback.
4.4. Scaling relations
Since the first numerical studies about the formation and the evolution of FDM haloes, it has been shown that the general properties of FDM haloes are tightly linked by a series of interesting scaling relations that result from the intrinsic scaling symmetries of the Schrödinger-Poisson system. When no net angular momentum is assumed, an FDM halo is primarily characterised by a single dimensionless parameter,
which is a scale-free invariant of the Schrödinger–Poisson system (Mocz et al. 2017; Bar et al. 2018). In Eq. (42), Mhalo corresponds to the viral mass of the dark halo, and |Ehalo| is its total energy, which can be approximated as
As in other numerical studies, we find a fundamental scaling relation between the core mass Mcore and Ξ of the form

This means that given its initial mass and energy, each FDM halo can be uniquely described by the Ξ parameter. In order to quantify the scaling of the core mass with the scale-free invariant Ξ, we used Eq. (44) to fit a data sample containing the selection of the five haloes described in Sect. 4.3, together with the different temporal realisations of HALO 2 presented in Sect. 4.2. Including the 1σ error on the parameters, the fit yields α = 1.21 ± 0.162 and β = 0.39 ± 0.043, which is consistent with the results of Mocz et al. (2017) (see also Schwabe et al. 2016; Du et al. 2017). Thus, when the parameter β is fixed to 1/3, the core–halo mass relation is given by

and it is shown in the upper panel of Fig. 7. If the total energy of the halo were furthermore approximated as  , Eq. (45) would imply a scaling of
  between the core and the halo masses. To verify the validity of this approximation, we also fit the same data sample with

 |
Fig. 7. Core–halo mass scaling relation for a representative selection of five FDM haloes. |
where we take the redshift dependence suggested by Schive et al. (2014b) explicitly into account. As expected, the fit yields α′ = 2.29 ± 0.709 and β′ = 0.55 ± 0.081. In the lower panel of Fig. 7, we show the alternative form of the core–halo mass relation provided by Eq. (46), and we note that the largest scatter among the data corresponds to HALO 2 at redshift z = 5 and to HALO 5 at redshift z = 2.5, which are characterised by small masses and might not yet be fully virialised. Other studies have found a similar core–halo mass relation, but with different values for the β′ exponent in Eq. (46). For example, Mocz et al. (2018) reported a value of β′ = 1/9, while Schive et al. (2014b) found a value of β′ = 1/3. The core–halo mass scaling has interesting implications. As mentioned by Schive et al. (2014b), the uncertainty principle in quantum mechanics is a local relation, but the core–halo mass relation links a local property such as the core mass to a global property such as the virial mass of the halo, implying that the uncertainty principle in this case holds non-locally.
At the same time, the core radius and its mass are tightly connected by the core mass–radius relation. With our definition of core radius, the solitonic core encloses roughly 25% of the total soliton mass. As a consequence, the core mass can be expressed as

This equation can be obtained by integrating the soliton profile given by Eq. (39). In Fig. 8 we show how the core mass computed for our sample of FDM haloes scales according to the core radius.
 |
Fig. 8. Core mass–radius scaling relation for a representative selection of five FDM haloes. |
4.5. Merging two FDM haloes
The merging process between FDM matter haloes has not been studied before in a realistic cosmological environment. Initially, collisions between self-gravitating solitons were studied in Bernal & Guzmán (2006). In this work, it was shown that if the total initial energy of a binary system is positive, the two solitons pass through each other, while in case of a negative total initial energy, the two soliton merge into one virialised structure. In Schive et al. (2014b), Mocz et al. (2017), and Schwabe et al. (2016), the merger between solitons has been reproduced from an idealised set of initial conditions, and it was shown that the core mass–radius and the core–halo mass scaling relations are preserved by the merging process. Furthermore, Schwabe et al. (2016) showed that the core mass resulting from a binary merger only depends on the mass ratio and on total initial mass and energy, while it is independent of the initial phase difference and angular momentum. In addition, when the progenitors have non-zero angular momentum, the final core becomes a rotating ellipsoid, which otherwise would be spherical.
In our simulation, the two most massive FDM haloes formed by redshift z = 4, namely HALO 1A and HALO 1B, start to approach each other slowly. By redshift z ∼ 3, they collide head-on and merge into a single large dark matter halo, namely HALO 1. The two progenitors of HALO 1 have very similar virial properties: with masses of M1a = 1.9 × 10⁹ M⊙ and M1b = 2.9 × 10⁹ M⊙, respectively, the merger event would be classified as a major merger. The final product, HALO 1, is a larger dark matter halo with a virial mass and comoving virial radius of M1 = 6.5 × 10⁹ M⊙ and R1 = 39.2 h−1 kpc.
The core radius of the progenitors HALO 1A and HALO 1B was computed by fitting their soltonic cores with Eq. (39). At redshift z = 4, right before the merging event starts, we find Rcore, 1a = 0.45 h−1 kpc and Rcore, 1b = 0.58 h−1 kpc in comoving units for HALO 1A and HALO 1B, respectively. At redshift z = 2.5, the final dark matter halo has a comoving core radius of Rcore, 1 = 0.16 h−1 kpc. As shown in Figs. 9 and 10, we also find that both the core mass–radius and the core–halo mass relations are preserved by the merging process. With a mass ratio between the progenitors of approximately μ = M1b/M1a ∼ 1.5, the core mass of the most massive progenitor is enhanced by the merger, in agreement with Schwabe et al. (2016), who showed that disruption of the least massive core is achieved only for mass ratios above μ > 7/3, and in this case, the least massive core is dispersed in the NFW-like outskirts of the most massive halo.
 |
Fig. 9. Core–halo mass scaling before and after the merging event of two FDM haloes. |
 |
Fig. 10. Core mass–radius scaling relation before and after the merging event of two FDM haloes. |
4.6. Core surface density
Dark matter cores have mostly been observed for low-mass galaxies with stellar masses of M* ≲ 1010 M⊙ and small baryon fractions (Li et al. 2020; Weinberg et al. 2015; Di Paolo & Salucci 2020). The density profiles of these low-mass dark haloes are commonly described by means of an isothermal profile (Burkert 1995),

which provides a better fit to the observed data. In Eq. (48), the free parameters ρ0 and r0 correspond to the central density and to the core radius, respectively.
Observations of dark matter cores have shown that the central density and the core radius are tightly related through the core surface density ΣDM = ρ0 r0 (e.g. Salucci & Burkert 2000; Burkert 2015; Kormendy 2015; Donato et al. 2009). This relation can provide strong constraints on any core formation mechanism, and Burkert (2020) recently argued that it is challenging for the FDM model to explain the observed cores. In Fig. 11 we compare our simulated FDM haloes with the properties of dark matter haloes hosting low surface brightness (LSB) dwarf galaxies (Di Paolo & Salucci 2020). We caution that a proper comparison would require a connection of the halo mass to the observed stellar mass, and we only aim at illustrating the general trend we found in our simulation for FDM haloes. As shown in the upper panel of Fig. 11, the observed dwarf galaxies are highly consistent with a constant core surface density, with an average of ΣDM = 75 M⊙ pc−2. However, in the case of FDM, the trend is drastically different. Equation (39) implies a scaling between the central core surface density and the core radius of  . In the bottom panel of Fig. 11, we show the dependence of the core radius on the virial mass of the halo. Whereas the observed data exhibit a positive scaling between the Rcore and Mhalo, our simulated FDM haloes follow the relation
  .
.
 |
Fig. 11. Relation between the dark matter surface density and the core radius of dark matter haloes (top). Relation between the core radius and the virial mass of dark matter haloes (bottom). The purple circles in both panelsrepresent the simulated FDM haloes, and the empty squares represent the properties of dark matter haloes hosting observed LSB dwarf galaxies (Di Paolo & Salucci 2020). In addition, the dashed black lines correspond to the result of the URC method presented in Salucci et al. (2007). |
5. Convergence tests
In order to show the limitations of this study and to highlight possible resolution issues that in general underlie this type of simulations, we performed two additional simulations of a smaller cosmological volume with B = 1.25 h−1 Mpc, with domain-grid resolution of 2563 cells and 5123 cells. We refer to them as FDM and FDM
 , and the original simulation is denoted FDM
 . Although the resolution at the finest level in the AMR hierarchy is sufficient to resolve the inner structure of dark haloes, the goal here was two investigate which physical probes are sensitive to the resolution achieved in low-density regions. Clearly, a higher domain-grid resolution improves the large-scale power spectrum, as shown in Fig. 12, where we plot the evolution of the dimensionless power spectrum Δ2(k) with redshift for simulations FDM
 and FDM
 . In the linear regime (i.e. early times and large scales), the evolution of larger modes for the low-resolution box does not exactly follow the matter power spectrum predicted by linear theory,
 |
Fig. 12. Evolution of the dimensionless power spectrum Δ2(k) with redshift for the runs FDM |


This same effect was recently noted in May & Springel (2021), who found that if the onset of non-linear evolution is not properly resolved, the power spectrum stops following linear growth on the largest scales. Moreover, the domain-grid resolution also affects the choice of the coarse-grid time step, and as a consequence, the onset of matter clustering takes place slightly later or before, depending on the domain-grid resolution.
In Fig. 13 we compare the dark matter density profiles of a selection of haloes from the two simulations FDM and FDM
 . Density profiles and rotation curves do not depend on the coarse-grid resolution, and the core surface density remains unchanged.
 |
Fig. 13. Comoving density profiles of a selection of FDM haloes for the runs FDM |


In Figs. 14 and 15, we show that the form of the scaling law characterising the Schrödinger-Poisson system is not affected by the choice of the coarse-grid resolution. However, the scaling exponent is sensitive to this choice, as pointed out previously in the literature (Bar et al. 2018, 2019b). In this case, we note that the scatter in the data points in Fig. 15 is larger than the difference between the two fits.
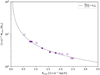 |
Fig. 14. Core mass–radius scaling relation for a selection of FDM haloes in FDM |


 |
Fig. 15. Core–halo mass scaling relation for a selection of FDM haloes in FDM |


Instead, the shape of the HMF is weakly sensitive to the coarse-grid resolution. The large-scale part of the HMF slightly improves when the resolution is increased, as shown in Fig. 16. The reason might be that the large-scale part of the HMF is affected by the poor statistics at these scales (only a few larger haloes formed in all simulations) and the haloes form slightly later in the low-resolution simulation FDM .
.
 |
Fig. 16. Halo mass function computed for the FDM |


The results of this section clearly show that it is crucial to resolve both small and large scales to completely study the non-linear structure formation process with FDM. Because of these limitations of the large-scale resolution, the main results of this article only describe the properties of single dark matter haloes or the statistical properties of a small collection of dark matter haloes that only interact by means of gravity, and they are reliable at large-scale resolution as well.
6. Conclusions
Within the ΛCDM framework, the process of structure formation has been extensively studied in the past decades. Numerical simulations have shown that the collisionless nature of CDM allows dark matter to form structures at all probed masses, and that dark matter clusters in gravitationally bound haloes follow the universal NFW density profile, Eq. (1). However, observations of rotation curves in small, compact, and dark matter-dominated systems such as dwarf galaxies indicate that the innermost region of dark matter haloes deviates from the NFW density profile. This region instead forms a small central core with nearly constant density. In addition, cosmological simulations have pointed out a strong mismatch between the number of observed low-mass subhaloes and the number of simulated structures. In the recent past, a variety of alternative dark matter models has therefore been suggested to describe the properties of the observed structures better. A promising alternative to the standard CDM is provided by models in which the dynamics of dark matter is described by means of an ultra-light scalar field, such as in the FDM model. High-resolution non-linear simulations are therefore required to test these models and to map their unique signatures.
In this preliminary work, we simulated a 2.5 h−1 Mpc box representing a small portion of the Universe in which the whole dark matter budget is in form of FDM, and it is described by a light complex scalar field with a mass of mB = 2.5 × 10⁻²² eV. While the dynamics of the scalar field is very similar to the CDM case on large scales, it significantly differs from standard CDM at small scales because the quantum nature of the scalar field manifests itself on astronomically relevant scales.
We studied the formation and evolution of FDM haloes and showed that the dynamics of a scalar field with such a low mass has many observational consequences that can be used to probe the true nature of dark matter in a cosmological context. Because we used a very high small-scale resolution, we were able to resolve the innermost structure of dark haloes. We also showed that FDM particles condense in the very centre of each structure, forming a coherent solitonic core. Among different structures formed in our simulation, we selected a representative sample of five FDM haloes at redshift z = 2.5 within a mass range 108 < Mhalo < 1010 M⊙, and we showed that the core radius depends upon the mass of the corresponding soliton, following the well-known core mass–radius relation. The central density profile is nearly constant on scales of the coherence length of the scalar field. While the solitonic core is well approximated by the soliton profile given by Eq. (39), the NFW-like outer region decays with a log-slope of γ ∼ −3, similarly to CDM haloes.
We also selected one FDM halo from the sample, and we studied the formation of the central soliton. We showed that the solitonic core evolves as the halo collapses under the effect of gravity, and we analysed its impact on the circular velocity profile of the dark halo. A central compact core leads to a prominent circular velocity peak in the rotation curve at much smaller radii from the centre than in the CDM case.
Furthermore, we characterised each dark halo in terms of the scale-free invariant Ξ, and we find that the simulated FDM haloes follow the core–halo mass relation Mcore/Mhalo ∝ Ξγ, characterised by a scaling exponent of γ = 1/3. The form of this scaling relation has been a critical investigation point for this class of alternative dark matter models, as different numerical studies found different scaling exponents for the core–halo mass relation. Our results are well in line with Mocz et al. (2017), who reported the same core–halo mass relation for the case of BECDM.
In addition, mergers between FDM halo have never been studied in a realistic cosmological scenario. In our simulated FDM Universe, two of the most massive dark haloes undergo a major merger between redshifts z ∼ 4 and z ∼ 3, and we find that the merging process preserves both the core mass–radius and core–halo mass scaling relations.
Moreover, we compared the core surface density ΣDM of the simulated FDM haloes with that of real dark haloes hosting observed LSB dwarf galaxies. For the FDM case, we find that the trend in both the ΣDM − Rcore and the Rcore − Mhalo relations differs from the observed properties of real dark haloes. As argued in Burkert (2020), the negative Rcore − Mhalo scaling found for the simulated FDM haloes represents a challenge to the FDM scenario as the sole explanation for the observed dark matter cores. To further investigate the ΣDM − Rcore and the Rcore − Mhalo relations, larger numerical simulations with the FDM model are required to analyse larger samples of FDM haloes and to cover a wider range of virial masses. In addition, baryonic physics can potentially change the predictions of FDM-only simulations in a non-trivial way. Thus, if the arguments provided by Burkert (2020) hold, even if FDM is capable of forming large solitonic cores in the centre of dark haloes, our results, together with previous results in the literature, suggest that the origin of the observed dark matter cores in low-mass astrophysical systems might have to be searched for somewhere else.
One potential shortcoming of this work is that the refinement strategy we adopted in our simulation employs a refinement criterion that is only based on a fixed density threshold at all refinement levels. As a future improvement, we consider to further develop SCALAR by improving the refinement strategy, including a criterion based on the Jeans length of collapsing objects. This criterion would be similar to the one adopted here, but with the difference of having a density threshold that varies as the Universe expands. Because the Jeans scale of FDM haloes is redshift dependent, a refinement criterion based on a constant-density threshold does not guarantee a sufficient resolution to resolve late-forming haloes, which typically have lower masses than early-forming FDM haloes. With a refinement strategy based on the Jeans length of collapsing object, the resolution required by these late-forming FDM haloes would automatically be achieved at any redshift and any mass scale. A refinement criterion based on the fluid velocity, as advocated by Schive et al. (2014b) to ensure that the field is well behaved in low-density regions, would also be an interesting investigation point to verify the robustness of the results obtained in this type of simulation. This is especially important considering that results from different groups have shown to differ slightly in their quantitative predictions while reaching similar conclusions.
In addition, we plan to investigate the dynamics of FDM further by including the baryonic content of the Universe in our description. Modelling the gas physics together with the astrophysical component of structure formation is crucial to make clear predictions based on numerical simulations of structure formation. The SCALAR code includes the hydrodynamics solver required for the gas physics and a sub-grid model for stellar feedback, as they were already implemented in the RAMSES code.
The code is availiable at https://github.com/dgrin1/axionCAMB
Acknowledgments
We thank the Research Council of Norway for their support. Computations were performed on resources provided by UNINETT Sigma2 – the National Infrastructure for High Performance Computing and Data Storage in Norway.
References
- Aarseth, S. J. 2003, Gravitational N-body Simulations: Tools and Algorithms, Cambridge Monographs on Mathematical Physics (Cambridge: Cambridge University Press) [CrossRef] [Google Scholar]
- Aarseth, S. J., & Hoyle, F. 1964, Astrophys. Nor., 9, 313 [NASA ADS] [Google Scholar]
- Bar, N., Blas, D., Blum, K., & Sibiryakov, S. 2018, Phys. Rev. D, 98, 083027 [NASA ADS] [CrossRef] [Google Scholar]
- Bar, N., Blum, K., Lacroix, T., & Panci, P. 2019a, JCAP, 2019, 045 [CrossRef] [Google Scholar]
- Bar, N., Blum, K., Eby, J., & Sato, R. 2019b, Phys. Rev. D, 99, 103020 [NASA ADS] [CrossRef] [Google Scholar]
- Bernal, A., & Guzmán, F. S. 2006, Phys. Rev. D, 74, 103002 [NASA ADS] [CrossRef] [Google Scholar]
- Boylan-Kolchin, M., Bullock, J. S., & Kaplinghat, M. 2011, MNRAS, 415, L40 [NASA ADS] [CrossRef] [Google Scholar]
- Boylan-Kolchin, M., Bullock, J. S., & Kaplinghat, M. 2012, MNRAS, 422, 1203 [NASA ADS] [CrossRef] [Google Scholar]
- Bozek, B., Marsh, D. J. E., Silk, J., & Wyse, R. F. G. 2015, MNRAS, 450, 209 [NASA ADS] [CrossRef] [Google Scholar]
- Brooks, A. M., Kuhlen, M., Zolotov, A., & Hooper, D. 2013, ApJ, 765, 22 [NASA ADS] [CrossRef] [Google Scholar]
- Burkert, A. 1995, ApJ, 447, L25 [NASA ADS] [Google Scholar]
- Burkert, A. 2015, ApJ, 808, 158 [NASA ADS] [CrossRef] [Google Scholar]
- Burkert, A. 2020, ApJ, 904, 161 [NASA ADS] [CrossRef] [Google Scholar]
- Calabrese, E., & Spergel, D. N. 2016, MNRAS, 460, 4397 [NASA ADS] [CrossRef] [Google Scholar]
- de Blok, W. J. G. 2010, Adv. Astron., 2010, 789293 [CrossRef] [Google Scholar]
- Di Paolo, C., & Salucci, P. 2020, ArXiv e-prints [arXiv:2005.03520] [Google Scholar]
- Dine, M., & Fischler, W. 1983, Phys. Lett. B, 120, 137 [NASA ADS] [CrossRef] [Google Scholar]
- Donato, F., Gentile, G., Salucci, P., et al. 2009, MNRAS, 397, 1169 [Google Scholar]
- Du, X., Behrens, C., Niemeyer, J. C., & Schwabe, B. 2017, Phys. Rev. D, 95, 043519 [NASA ADS] [CrossRef] [Google Scholar]
- Dubois, Y., Pichon, C., Welker, C., et al. 2014, MNRAS, 444, 1453 [Google Scholar]
- Edwards, F., Kendall, E., Hotchkiss, S., & Easther, R. 2018, JCAP, 2018, 027 [CrossRef] [Google Scholar]
- Flores, R. A., & Primack, J. R. 1994, ApJ, 427, L1 [NASA ADS] [CrossRef] [Google Scholar]
- Gentile, G., Salucci, P., Klein, U., Vergani, D., & Kalberla, P. 2004, MNRAS, 351, 903 [Google Scholar]
- González-Morales, A. X., Marsh, D. J. E., Peñarrubia, J., & Ureña-López, L. A. 2017, MNRAS, 472, 1346 [CrossRef] [Google Scholar]
- González-Samaniego, A., Bullock, J. S., Boylan-Kolchin, M., et al. 2017, MNRAS, 472, 4786 [CrossRef] [Google Scholar]
- Governato, F., Zolotov, A., Pontzen, A., et al. 2012, MNRAS, 422, 1231 [Google Scholar]
- Hlozek, R., Grin, D., Marsh, D. J. E., & Ferreira, P. G. 2015, Phys. Rev. D, 91, 103512 [NASA ADS] [CrossRef] [Google Scholar]
- Hu, W., Barkana, R., & Gruzinov, A. 2000, Phys. Rev. Lett., 85, 1158 [NASA ADS] [CrossRef] [Google Scholar]
- Hui, L., Ostriker, J. P., Tremaine, S., & Witten, E. 2017, Phys. Rev. D, 95, 043541 [NASA ADS] [CrossRef] [Google Scholar]
- Klypin, A., Kravtsov, A. V., Valenzuela, O., & Prada, F. 1999, ApJ, 522, 82 [Google Scholar]
- Knollmann, S. R., & Knebe, A. 2009, ApJS, 182, 608 [Google Scholar]
- Kopp, M., Vattis, K., & Skordis, C. 2017, Phys. Rev. D, 96, 123532 [NASA ADS] [CrossRef] [Google Scholar]
- Kormendy, J. 2015, Structure and Evolution of Dwarf Galaxies (Switzerland: Springer International Publishing), 323 [Google Scholar]
- Lee, J.-W., & Koh, I.-G. 1996, Phys. Rev. D, 53, 2236 [Google Scholar]
- Li, X., Hui, L., & Bryan, G. L. 2019, Phys. Rev. D, 99, 063509 [NASA ADS] [CrossRef] [Google Scholar]
- Li, P., Lelli, F., McGaugh, S., & Schombert, J. 2020, ApJS, 247, 31 [Google Scholar]
- Madelung, E. 1926, Naturwissenschaften, 14, 1004 [Google Scholar]
- Marsh, D. J. E. 2015, Phys. Rev. D, 91, 123520 [NASA ADS] [CrossRef] [Google Scholar]
- Marsh, D. J. E. 2016, Phys. Rep., 643, 1 [NASA ADS] [CrossRef] [Google Scholar]
- Marsh, D. J. E., & Ferreira, P. G. 2010, Phys. Rev. D, 82, 103528 [NASA ADS] [CrossRef] [Google Scholar]
- Marsh, D. J. E., & Pop, A.-R. 2015, MNRAS, 451, 2479 [NASA ADS] [CrossRef] [Google Scholar]
- May, S., & Springel, V. 2021, MNRAS, 506, 2603 [NASA ADS] [CrossRef] [Google Scholar]
- McGaugh, S. S., Schombert, J. M., Bothun, G. D., & de Blok, W. J. G. 2000, ApJ, 533, L99 [Google Scholar]
- Mina, M., Mota, D. F., & Winther, H. A. 2020, A&A, 641, A107 [EDP Sciences] [Google Scholar]
- Mocz, P., Vogelsberger, M., Robles, V. H., et al. 2017, MNRAS, 471, 4559 [Google Scholar]
- Mocz, P., Lancaster, L., Fialkov, A., Becerra, F., & Chavanis, P.-H. 2018, Phys. Rev. D, 97, 083519 [NASA ADS] [CrossRef] [Google Scholar]
- Mocz, P., Fialkov, A., Vogelsberger, M., et al. 2020, MNRAS, 494, 2027 [NASA ADS] [CrossRef] [Google Scholar]
- Moore, B. 1994, Nature, 370, 629 [NASA ADS] [CrossRef] [Google Scholar]
- Moore, B., Ghigna, S., Governato, F., et al. 1999, ApJ, 524, L19 [Google Scholar]
- Mortlock, D., Warren, S., Venemans, B., et al. 2011, Nature, 474, 616 [Google Scholar]
- Navarro, J. F., Frenk, C. S., & White, S. D. M. 1996, ApJ, 462, 563 [Google Scholar]
- Nori, M., & Baldi, M. 2018, MNRAS, 478, 3935 [Google Scholar]
- Nori, M., & Baldi, M. 2021, MNRAS, 501, 1539 [Google Scholar]
- Peebles, P. J. E. 2000, ApJ, 534, L127 [NASA ADS] [CrossRef] [Google Scholar]
- Planck Collaboration VI. 2018, A&A, 641, A6 [Google Scholar]
- Preskill, J., Wise, M. B., & Wilczek, F. 1983, Phys. Lett. B, 120, 127 [NASA ADS] [CrossRef] [Google Scholar]
- Salucci, P., & Burkert, A. 2000, ApJ, 537, L9 [NASA ADS] [CrossRef] [Google Scholar]
- Salucci, P., Lapi, A., Tonini, C., et al. 2007, MNRAS, 378, 41 [CrossRef] [Google Scholar]
- Schaye, J., Crain, R. A., Bower, R. G., et al. 2015, MNRAS, 446, 521 [Google Scholar]
- Schive, H.-Y., Chiueh, T., & Broadhurst, T. 2014a, Nat. Phys., 10, 496 [NASA ADS] [CrossRef] [Google Scholar]
- Schive, H.-Y., Liao, M.-H., Woo, T.-P., et al. 2014b, Phys. Rev. Lett., 113, 261302 [NASA ADS] [CrossRef] [Google Scholar]
- Schive, H.-Y., Chiueh, T., Broadhurst, T., & Huang, K.-W. 2016, ApJ, 818, 89 [NASA ADS] [CrossRef] [Google Scholar]
- Schwabe, B., Niemeyer, J. C., & Engels, J. F. 2016, Phys. Rev. D, 94, 043513 [Google Scholar]
- Springel, V. 2005, MNRAS, 364, 1105 [Google Scholar]
- Teyssier, R. 2002, A&A, 385, 337 [CrossRef] [EDP Sciences] [Google Scholar]
- Tinker, J., Kravtsov, A. V., Klypin, A., et al. 2008, ApJ, 688, 709 [Google Scholar]
- Turk, M. J., Smith, B. D., Oishi, J. S., et al. 2011, ApJS, 192, 9 [NASA ADS] [CrossRef] [Google Scholar]
- Uhlemann, C., Kopp, M., & Haugg, T. 2014, Phys. Rev. D, 90, 023517 [NASA ADS] [CrossRef] [Google Scholar]
- Vogelsberger, M., Genel, S., Springel, V., et al. 2014, Nature, 509, 177 [Google Scholar]
- Weinberg, D. H., Bullock, J. S., Governato, F., Kuzio de Naray, R., & Peter, A. H. G. 2015, Proc. Natl. Acad. Sci., 112, 12249 [NASA ADS] [CrossRef] [Google Scholar]
- Widrow, L. M., & Kaiser, N. 1993, ApJ, 416, L71 [NASA ADS] [CrossRef] [Google Scholar]
- Woo, T.-P., & Chiueh, T. 2009, ApJ, 697, 850 [NASA ADS] [CrossRef] [Google Scholar]
- Zhang, J., Sming Tsai, Y.-L., Kuo, J.-L., Cheung, K., & Chu, M.-C. 2018, ApJ, 853, 51 [NASA ADS] [CrossRef] [Google Scholar]
Appendix A: Initial conditions
In order to generate suitable initial conditions, we first obtained the linear matter power spectrum from the publicly available code AxionCAMB (Hlozek et al. 2015), which was then used to generate a Gaussian realisation of δ(k, zini). In order to generate the initial wave-function, we considered the Schrödinger-Poisson system in the Madelung form. In particular, by expressing the wave-function in polar coordinates,

Again, macroscopic quantities such as density and velocity are defined by means of


Here δ represents an overdensity rather than the density itself. Then, the first Madelung equation can be written as
![$$ \begin{aligned} \frac{d\delta }{dt} + \frac{1}{a} \nabla \cdot \left[\left(1+\delta \right) \mathbf v \right] = 0. \end{aligned} $$](/articles/aa/full_html/2022/06/aa38876-20/aa38876-20-eq88.gif)
In the linear regime, initial conditions can be generated by using the Zel’dovich approximation (see Kopp et al. 2017 for a more general description),

where D is the growth factor. Thus, in the linear regime,

where f ≡ d log D/d log a is the growth rate. The Fourier transform of the phase is then calculated according to

Then, overdensity and phase in real space were obtained by performing a backward Fourier transform.
All Figures
|
Fig. 1. Projection along the z-axes of the dark matter density field, normalised by the critical density of the Universe. The box is 2.5 Mpc h−1 in comoving units, and it represents the entire simulation box. |
| In the text | |
|
Fig. 2. Slice along the z-axis across one of the first structures that formed in our simulation box. Each panel represents a slice of 200 h−1 kpc on a side in comoving units. The density is normalised by the critical density of the Universe. |
| In the text | |
|
Fig. 3. Comoving density (left panel) and circular velocity (right panel) profiles of HALO 2 at redshifts z = 5.0, 4.6, 4.2, 3.6, 2.8, and 2.5. At these redshifts, HALO 2 is characterised by a mass of Mz = 5.0 = 1.71 × 10⁸ M⊙, Mz = 4.6 = 3.44 × 10⁸ M⊙, Mz = 4.2 = 5.73 × 10⁸ M⊙, Mz = 3.6 = 9.73 × 10⁸ M⊙, Mz = 2.8 = 2.09 × 10⁹ M⊙, and Mz = 2.5 = 2.25 × 10⁹ M⊙. |
| In the text | |
|
Fig. 4. Density (upper panel) and circular velocity (bottom panel) profiles of HALO 2 at redshift z = 2.5. The solid lines show the FDM (green) and the CDM (blue) haloes. While the dotted green line represents result of the fit of the solitonic core found in the FDM halo, the dotted blue line represents the result of the NFW fit of the CDM halo. |
| In the text | |
|
Fig. 5. Dark matter density profiles (left panel) and rotation curves (right panel) of a representative sample of five FDM haloes found at redshift z = 2.5. The density of each individual halo is expressed in units of its central density. Similarly, the radial distance is normalised to the core radius of each individual halo. In both panels, the vertical dashed line corresponds to r = 3 Rcore, marking the point where the solitonic profile breaks. The masses of the haloes shown in this figure are M1 = 6.52 × 10⁹ M⊙, M2 = 1.55 × 10⁹ M⊙, M3 = 2.25 × 10⁹ M⊙, M4 = 2.30 × 10⁸ M⊙, and M5 = 8.46 × 10⁷ M⊙. |
| In the text | |
|
Fig. 6. Halo mass function computed for the FDM and CDM simulations. The solid black line corresponds to the analytical estimate of the HMF in a ΛCDM cosmology at z = 2.5, based on Tinker et al. (2008). |
| In the text | |
|
Fig. 7. Core–halo mass scaling relation for a representative selection of five FDM haloes. |
| In the text | |
|
Fig. 8. Core mass–radius scaling relation for a representative selection of five FDM haloes. |
| In the text | |
|
Fig. 9. Core–halo mass scaling before and after the merging event of two FDM haloes. |
| In the text | |
|
Fig. 10. Core mass–radius scaling relation before and after the merging event of two FDM haloes. |
| In the text | |
|
Fig. 11. Relation between the dark matter surface density and the core radius of dark matter haloes (top). Relation between the core radius and the virial mass of dark matter haloes (bottom). The purple circles in both panelsrepresent the simulated FDM haloes, and the empty squares represent the properties of dark matter haloes hosting observed LSB dwarf galaxies (Di Paolo & Salucci 2020). In addition, the dashed black lines correspond to the result of the URC method presented in Salucci et al. (2007). |
| In the text | |
|
Fig. 12. Evolution of the dimensionless power spectrum Δ2(k) with redshift for the runs FDM |
| In the text | |
|
Fig. 13. Comoving density profiles of a selection of FDM haloes for the runs FDM |
| In the text | |
|
Fig. 14. Core mass–radius scaling relation for a selection of FDM haloes in FDM |
| In the text | |
|
Fig. 15. Core–halo mass scaling relation for a selection of FDM haloes in FDM |
| In the text | |
|
Fig. 16. Halo mass function computed for the FDM |
| In the text | |
Current usage metrics show cumulative count of Article Views (full-text article views including HTML views, PDF and ePub downloads, according to the available data) and Abstracts Views on Vision4Press platform.
Data correspond to usage on the plateform after 2015. The current usage metrics is available 48-96 hours after online publication and is updated daily on week days.
Initial download of the metrics may take a while.