| Issue |
A&A
Volume 662, June 2022
|
|
|---|---|---|
| Article Number | A74 | |
| Number of page(s) | 10 | |
| Section | Interstellar and circumstellar matter | |
| DOI | https://doi.org/10.1051/0004-6361/202142269 | |
| Published online | 21 June 2022 | |
An extended scattered light disk around AT Pyx
Possible planet formation in a cometary globule★
1
Anton Pannekoek Institute for Astronomy, University of Amsterdam,
Science Park 904,
1098XH
Amsterdam,
The Netherlands
e-mail: [email protected]
2
Leiden Observatory, Leiden University,
2300 RA
Leiden,
The Netherlands
3
INAF – Osservatorio Astronomico di Padova,
Vicolo dell’Osservatorio 5,
35122
Padova,
Italy
4
Univ. Grenoble Alpes, CNRS, IPAG,
38000
Grenoble,
France
5
Unidad Mixta Internacional Franco-Chilena de Astronomía (CNRS, UMI 3386), Departamento de Astronomía, Universidad de Chile,
Camino El Observatorio 1515, Las Condes,
Santiago,
Chile
6
Universidad de los Andes,
Mérida,
Venezuela
7
Max Planck Institute for Astronomy,
Königstuhl 17,
69117
Heidelberg,
Germany
8
Institute for Particle Physics and Astrophysics, ETH Zurich,
Wolfgang-Pauli-Strasse 27,
8093
Zurich,
Switzerland
9
LESIA, Observatoire de Paris, Université PSL, CNRS, Sorbonne Université, Univ. Paris Diderot,
Sorbonne Paris Cité, 5 place Jules Janssen,
92195
Meudon,
France
10
Núcleo de Astronomía, Facultad de Ingeniería y Ciencias, Universidad Diego Portales,
Av. Ejercito 441,
Santiago,
Chile
11
Department of Astronomy, Stockholm University,
10691
Stockholm,
Sweden
12
CRAL, CNRS, Université Lyon 1, Université de Lyon, ENS,
9 avenue Charles Andre,
69561
Saint Genis Laval,
France
13
Aix Marseille Univ, CNRS, CNES, LAM,
Marseille,
France
14
Geneva Observatory, University of Geneva,
Chemin des Maillettes 51,
1290
Sauverny,
Switzerland
15
University of Michigan, Astronomy Department,
1085 S. University Ave.,
Ann Arbor,
MI
48109-1107,
USA
16
Hamburger Sternwarte,
Gojenbergsweg 112,
21029
Hamburg,
Germany
17
DOTA, ONERA, Université Paris Saclay,
91123,
Palaiseau
France
18
NOVA Optical Infrared Instrumentation Group,
Oude Hoogeveensedijk 4,
7991
PD Dwingeloo,
The Netherlands
Received:
21
September
2021
Accepted:
21
November
2021
Aims. To understand how the multitude of planetary systems that have been discovered come to be, we need to study systems at different evolutionary stages, with different central stars but also in different environments. The most challenging environment for planet formation may be the harsh UV radiation field of nearby massive stars which quickly erodes disks by external photo-evaporation. We observed the AT Pyx system, located in the head of a cometary globule in the Gum Nebula, to search for signs of ongoing planet formation.
Methods. We used the extreme adaptive optics imager VLT/SPHERE in Dual Beam Polarization Imaging Mode in H-band as well as in IRDIFS Extended mode (K12-band imaging and Y-H integral field spectroscopy) to observe AT Pyx in polarized light and total intensity. Additionally, we employed VLT/NACO to observe the system in the L-band.
Results. We resolve the disk around AT Pyx for the first time in scattered light across multiple wavelengths in polarized light and total intensity. We find an extended (≥126 au) disk, with an intermediate inclination of between 35° and 42°. The disk shows a complex substructure and we identify two or possibly three spiral-like features. Depending on the precise geometry of the disk (which we cannot unambiguously infer from our data), the disk may be eccentric with an eccentricity of ~0.16 or partially self-shadowed. The spiral features and possible eccentricity are both consistent with signatures of an embedded gas giant planet with a mass of ~1 MJup. Our own observations can rule out brown dwarf companions embedded in the resolved disk, but are nevertheless not sensitive enough to confirm or rule out the presence of a gas giant.
Conclusions. AT Pyx is the first disk to be spatially resolved in a cometary globule in the Gum Nebula. By comparison with disks in the Orion Nebula Cluster we note that the extension of the disk may be exceptional for this environment if the external UV radiation field is indeed comparable to other cometary globules in the region. The signposts of ongoing planet formation are intriguing and need to be followed up with either higher sensitivity or at different wavelengths.
Key words: planets and satellites: formation / protoplanetary disks / instrumentation: adaptive optics / techniques: polarimetric / instrumentation: high angular resolution
© ESO 2022
1 Introduction
AT Pyx (= IRAS 08267-3336, WRAY15-220) is a young intermediate-mass star located in the Gum Nebula (Herczeg & Hillenbrand 2014), a large H II region in the southern hemisphere. Its distance was recently revised by Gaia to be 370 ± 5 pc (Gaia Collaboration 2021; Lindegren et al. 2021). Using the luminosity and temperature derived by Herczeg & Hillenbrand (2014) and re-scaled to the new Gaia distance in combination with Siess et al. (2000) stellar isochrone models, we find a stellar mass of 1.5 ± 0.1 M⊙ and an age of  Myr.
Myr.
AT Pyx was first identified as a pre-main sequence star by Pettersson (1987), who measured significant Hα emission. We show the spectral energy distribution (SED) of the system in Fig. 1, assembled from various photometric catalogs. We note that Herczeg & Hillenbrand (2014) measured an extinction of AV = 1.2 mag toward the system. A clear infrared (IR) excess is present at wavelengths longer than 10 µm. The dip in emission at the same wavelength is typical for a transition disk with an inner cavity. Garufi et al. (2018) find a fractional near-infrared (NIR) excess of FNIR/F* = 20.5 ± 2.3% and a far-infrared (FIR) excess of FNIR/F*= 39.8 ± 3.2%. The large FIR excess is comparable to that of well-known extended disks such as the ones around HD142527 (Rodigas et al. 2014; Avenhaus et al. 2014) or GG Tau (McCabe et al. 2002; Itoh et al. 2014; Keppler et al. 2020). The lower NIR excess, compared to the FIR excess, is typical for disks bright in scattered light (Garufi et al. 2018).
In the All-Sky Automated Survey for SuperNovae (ASAS-SN) catalog (Jayasinghe et al. 2019), a strong V-band variability of AT Pyx was found with an amplitude of 1.45 mag and timescales on the order of days. This may indicate that AT Pyx is a so-called “dipper” star in which inner disk material is obscuring the star periodically (see e.g., Stauffer et al. 2015; McGinnis et al. 2015).
The system is located in the head of a cometary globule (see Fig. 2, left), which is a dense region of molecular gas with a fading tail (Hawarden & Brand 1976). The origin of the cometary globules are still not entirely clear. They may have been caused by the shock-wave of the high-mass companion of ζ Pup which went supernova roughly 1.5 Myr ago (Sahu et al. 1988), or they may be caused by the interaction with the intense radiation field of the Vela OB association (Choudhury & Bhatt 2009). Cometary globules have been found to be sites of enhanced star formation, likely triggered by the same event that created the Gum Nebula (Bhatt 1993).
Due to the UV environment caused by the nearby Vela OB association, it is thought that circumstellar disks should have a shortened lifetime compared to low-mass star forming regions. Indeed, Kim et al. (2005) found that out of the 11 PMS stars located in cometary globules that they observed, only 1 showed a significant IR excess. This lead them to the conclusion that the typical disk lifetime should be shorter than 5 Myr due to external photo-evaporation. However, the cometary globules observed by Kim et al. (2005) are located closer to the O4 star ζ Pup than the cometary globule that hosts AT Pyx, and therefore the UV background radiation should be lower in the case of AT Pyx.
Güdel et al. (2010) detected ionized Neon in the mid-infrared (MIR) towards AT Pyx, indicative of stellar X-ray or extreme ultraviolet (EUV) radiation hitting the surface of a circumstellar disk. This may be an indication of an enhanced EUV external radiation field, but might also be explained by the chromospheric activity of AT Pyx itself.
In this study we present high-resolution scattered light observations of the AT Pyx system in the NIR with VLT/SPHERE (Beuzit et al. 2019) and VLT/NACO (Lenzen et al. 2003; Rousset et al. 2003).
 |
Fig. 1 Observed SED of AT Pyx based on photometric values (no de-reddening applied). The surveys from which measurements were taken are indicated by color coding. We note that the two longest wavelength AKARI data points may suffer from contamination, which may explain their discrepancy (Yamamura et al. 2010). |
2 Observations and data reduction
In the following we describe our observation setup and the data reduction of all observing epochs.
2.1 SPHERE observations
2.1.1 Polarimetric observations
AT Pyx was observed on May 15, 2017, with SPHERE/IRDIS (Dohlen et al. 2008) in dual polarization imaging mode (DPI, Langlois et al. 2014; de Boer et al. 2020; van Holstein et al. 2020). Observations were carried out in H-band with a coronagraph blocking the central region of the system (92.5 mas inner working angle, Carbillet et al. 2011) and the instrument de-rotator operating in field-stabilized mode. The observations were part of the SPHERE guaranteed time survey of nearby T Tauri stars. We give the detailed observation setup and conditions in Table 1.
The data reduction was performed with the IRDIS pipeline for Accurate Polarimetry (IRDAP, van Holstein et al. 2020) using default parameters. The details of the data reduction are described in van Holstein et al. (2020). We show the final Qϕ image in the bottom-right panel of Fig. 2. The Qϕ image contains all the azimuthally polarized signal as positive values and all radial polarized signal as negative values; see de Boer et al. (2020) and Monnier et al. (2019) for a detailed explanation. For a single star illuminating a nearly face-on circumstellar disk we expect in principle only azimuthally polarized light and thus the Qϕ image should give the majority of the scattered light signal received from the system. We additionally show the initial combined and flux calibrated Stokes Q and U images as well as the complementary Uϕ image in Appendix A.
2.1.2 Intensity observations
We observed AT Pyx in SPHERE IRDIFS mode on April 18, 2018, within the SPHERE Consortium Guaranteed Time Observations. The IRDIFS-EXT mode uses – simultaneously – the Integral Field Spectrograph (IFS: Claudi et al. 2008) over the wavelength range 0.95–1.65 µm at a spectral resolution of R ~ 30 (field of view 1.77 arcsec square) and the dual band imager IRDIS (Dohlen et al. 2008) for the K1 and K2 narrow bands at 2.09 and 2.22 µm, respectively, over a wider field of view of ~10 arcsec square. We used the ALC_Ks coronograph (Boccaletti et al. 2008) with a field mask of 120 mas in radius. Observing conditions were excellent with a median DIMM seeing FWHM of 0.82 arcsec and a coherence time of 9.4 ms, which provided an average Strehl ratio of 0.62 in the K-band on this optically faint (G mag = 13.45, Gaia Collaboration 2018) target. The observations were carried out in pupil stabilized mode and the total field rotation angle was 77.6 degrees. The observing sequence included in addition to the science exposure (a total of 4608 son target), observations with the star offset by about 0.5 arcsec with respect the coronagraph for flux and point spread function calibration, observations with a bi-dimensional sinusoidal pattern imprinted on the deformable mirror to provide faint replicas of the stellar image for fine centering (Beuzit et al. 2019) and background sky observations.
Data were reduced using the SPHERE DRH pipeline (Pavlov et al. 2008) and additional routines available at the SPHERE Data Center (Delorme et al. 2017). The data were then analyzed using the SPECAL routines (Galicher et al. 2018), which includes simple rotation and sum, angular differential imaging (ADI: Marois et al. 2006), TLOCI (Marois et al. 2014); and principal component analysis (PCA: Soummer et al. 2012; Amara & Quanz 2012). For IFS, we also used additional routines based on the PCA method simultaneously in space and wavelength coordinates developed at INAF – Osservatorio Astronomico di Padova (Mesa et al. 2015).
 |
Fig. 2 Left: dark Energy Cam Plane Survey (DECaPS, Schlafly et al. 2018) optical multi-band image of the head of the cometary globule CG-22 in the Gum Nebula. The red dashed lines indicate the position of AT Pyx. Right from top to bottom: NACO L-band ADI image of the disk around AT Pyx; SPHERE K-band ADI image and SPHERE H-band polarized light image. |
Observation setup and observing conditions.
2.2 NACO observations
The NACO observations were obtained on January 19, 2019, as part of the ISPY (Imaging Survey for Planets around Young stars, Launhardt et al. 2020) observation campaign. Observations were carried out in the L’ filter with the L27 objective and a pixel scale of 27.19 mas. As AT Pyx is relatively faint in the L-band, no coronagraph was used to block the central star. To accurately sample the variable sky background in the L-band the individual frame exposure time was set to 0.2 s. The total integration was 46 min. The observation setup and conditions are summarized in Table 1.
The data were reduced using the IPAG-ADI pipeline (Chauvin et al. 2012). Data calibration (flat-fielding, bad pixels, and sky removal) was performed as a first step on all available cubes. To reduce computation time, subframes of 90 × 90 pixels (FoV of 2.4″ × 2.4″) were extracted. Finally, these frames were re-centered and bad frames (poorly saturated, overly extended PSF) were removed to obtain a final master cube used for the data reduction.
The pipeline allows for the use of multiple flavors of ADI algorithms, namely classical ADI (cADI), smart ADI (sADI), radial ADI (rADI), all described in Chauvin et al. (2012), as well as Locally Optimized Combination of Images (LOCI, Lafrenière et al. 2007) and Principal Component Analysis (PCA, Soummer et al. 2012). The use of multiple ADI techniques, together with the LOCI and PCA reduction, allows for comparison and consistency on the results obtained. For sADI and LOCI, we followed a similar configuration as Chauvin et al. (2012), with a FWHM = 4.5 pixels and a separation criteria of 0.75 × FWHM at the companion separation. For the PCA method (e.g., Soummer et al. 2012), observations were reduced using three different numbers of modes (k = 1, 5, 20) and masking the image outside of a radius of 60 pixels.
 |
Fig. 3 Left: SPHERE/IFS image after angular differential imaging was applied to remove the stellar light component. Center: SPHERE/IRDIS K-band image after angular differential imaging. Right: SPHERE/IRDIS H-band image after polarization differential imaging. A high pass filter was applied to highlight high spatial frequency features and make the image more comparable to the K-band and the IFS images. We mark similar features in all three images with dashed lines for the “spiral-like” features S1-S3 and with continuous lines for the “arc-like” features A1 and A2. In the center panel, we specifically point out the discontinuity between features S1 and A1 in the north. We note that the flux calibrations are not absolute values due to the varying throughput of the different data processing methods (this also explains the negative flux values). They can be used to follow variations within each panel but are not comparable between panels. |
3 The scattered light disk
Our multi-wavelength scattered light observations reveal an extended disk with complex substructures. In Fig. 3 we highlight the most prominent structures in the SPHERE IFS and IRDIS data sets. We find two arc-like structures to the east (A1) and west (A2) of the central star, best visible in the IRDIS data sets (and to a lesser degree in the NACO data set in Fig. 2)1. These features may present an outer ring of the disk. We also find three spiral-like features starting in the north and east of the innermost disk area that we resolve and winding counter-clockwise (features S1–S3). These potential spirals are detected in all SPHERE images, but their position and shape changes slightly between the three data sets presented in Fig. 3. This is likely an effect of the post-processing method applied to the IFS and IRDIS K-band data. ADI processing is well known to alter the shape of extended features due to self-subtraction (see e.g., Milli et al. 2012; Ginski et al. 2016). The H-band polarized light image does not suffer from this effect and thus traces the morphology of the features most reliably. To allow for an easier cross-identification of the various features between the data sets, we show the IRDIS K-band data as well as the NACO L-band data, with the SPHERE H-band polarimetric data overlayed in contours in Figs. B.1 and B.2.
The interpretation of the observed structures depends strongly on the projection effects due to the disk inclination. Given our data, we propose two scenarios for the disk inclination and position angle which we also illustrate in Fig. 4:
Disk position angle of ~90°. The features A1 and A2 could represent the ansae of an inclined disk. They appear particularly bright in polarized light, which could be an effect of the polarized phase function peaking at scattering angles of ~90°. If this is the case, then we would expect the near side of the disk to be in the north, because in all data sets we receive more flux from the north compared to the south, consistent with smaller scattering angles. If this interpretation is correct then we should be able to fit features A1 and A2 with a single ellipse (assuming that both features trace the same height structure in scattered light). As is visible in Fig. 3, the curvature of feature A1 appears to be larger than of feature A2, which is inconsistent with this picture. However, it may be that we misidentified feature S1 as an individual spiral-like feature and that instead it is a continuation of feature A2. In this case the discontinuity between the eastern tip of S1 and the northern tip of A1, which is highlighted in the central panel of Fig. 3, is puzzling. Such a discontinuity might be explained if a shadow is cast on the outer ring from an inner (unresolved) disk with a relative inclination, similar to the case of the HD 142527 system (see e.g., Marino et al. 2015). The corresponding shadow in the south might then not be detected due to the general low signal in that region. It might also be possible that feature S1 is a spiral arm that is significantly lifted above the disk surface profile. In this case, the discontinuity might simply be a projection effect. A combination of both explanations for the appearance of the northern side of the disk is also possible, that is, a spiral arm with a significantly increased scale height compared to the surrounding disk, which casts shadows on the surrounding structures.
If we fit features A1 and A2 (ignoring feature S1) with an ellipse, then we find an inclination of the disk of ~42° and a semi-major axis of the outer features of ~126 au. However, to allow for a simultaneous fit of both features with the same ellipse, the center needs to be offset from the central star by 55 mas. Such an offset along the major axis cannot be explained by projection effects and would indicate that the disk is eccentric with an eccentricity of ~0.16.
Disk position angle of ~0°. In order to allow for a non-eccentric outer ring traced by features A1 and A2, we consider that the disk position angle might rather be close to ~0°. In this scenario, it is possible to fit both features with an ellipse with an offset along the minor axis of the disk. This offset can be explained by the projection of a flared and inclined disk with the near side in the west (see e.g., de Boer et al. 2016). Feature A2 appears brighter than A1 in the SPHERE H-band and the K-band images2. This may then be explained by the scattering phase function, if A2 is the near side and thus is seen under smaller angles. This is consistent with feature A2 being closer to the stellar position in the 2D plane than feature A1. Assuming this position angle, we find a similar inclination of the disk to the previous scenario of ~35° with a semi-major axis of the outer features of ~ 145 au. However, we caution that in this scenario the ansae of the disk are not seen, and so the semi-major axis and the inclination are less constrained.
If we assume this orientation, then the lack of flux in the south and southwest in the polarized light data is puzzling, because these areas would be seen under close to 90° scattering angles and the degree of polarization should be near maximum compared to any other area in the disk. Thus, if this is the correct disk orientation we require that the south and southwest but also the north and northeast are shadowed by interior structures. In the north this may be due to the spiral-like features S1 and S2. While S3 seemingly extends into the south in the left panel of Fig. 3, it does not extend visibly to the southwest, where we would expect the peak of the polarized scattered light signal. However, the polarized light H-band data show signal close to the coronagraph in the north and south, which is most visible in the right panel of Fig. 3. If this signal traces an inner disk that is misaligned with respect to the outer disk, traced by features A1 and A2, then this may produce the required shadowing along the ansae.
Based on our data sets, we are unable to unambiguously determine which of the proposed scenarios represents the correct interpretation of the disk morphology. Longer wavelength data, such as millimeter continuum or line emission observations, are needed to disentangle the large- and small-scale morphology of the disk. We do note however that the strong optical variability of AT Pyx might favor a rather inclined inner disk, consistent with the shadowing scenario and a disk position angle of 0°.
 |
Fig. 4 Schematic of the two scenarios to explain the scattered light features of the disk around AT Pyx. Scenario 1 (left) proposes an eccentric disk with a position angle of the major axis of 90°. Scenario 2 (right) proposes a circular disk with a position angle of 0° and a misaligned inner disk, which shadows the ansae of the visible outer disk. For both scenarios, we show a schematic of the actual view (top row) and of the de-projected top-down view (bottom row). |
4 Planet detection limits
The spiral features discussed in the previous section might be an indication of a perturber embedded in the disk, such as a forming planet or a low-mass stellar component. Both of these latter objects would be expected to be brightest relative to the central star at long wavelengths. Additionally, the optical depth of the disk decreases towards longer wavelengths allowing us to observe more embedded objects.
In neither the SPHERE K-band data nor the NACO L-band data do we find unambiguous signatures of a point source in or directly outside the disk. We note that due to the complex substructure in combination with the ADI processing, it is possible to produce false-positive or false-negative results (see e.g., the case of LkCa 15, Currie et al. 2019). In Fig. 2, there is a tantalizing point-like feature present in the NACO data at a separation of roughly 0.1″ to the southwest of the star. However, this signal has no counterpart in the higher contrast SPHERE K-band or the SPHERE IFS data. We therefore assume it is an ADI-distorted disk structure or a remnant of the stellar PSF.
Using the SPHERE and NACO data, we computed contrast limits, which are shown in Fig. 5. To transform these contrast limits into mass detection limits, we used AMES-DUSTY models (Allard et al. 2012), with a system age of 5 Myr. To compute absolute magnitudes from the contrast limits we utilized the 2MASS K-band magnitude of the system of 9.044 ± 0.021 mag for the SPHERE data. For the NACO L-band data at a wavelength of 3.8 µm, we interpolate between the WISE W1 magnitude at 3.4 µm and the W2 magnitude at 4.6 µm. We calculate a value of 7.75 ± 0.03 mag.
We find that outside of 1″ (i.e., outside of disk features A1 and A2), we are sensitive to 5 MJup planets in the SPHERE data and 20 MJup brown dwarfs in the NACO data. Inside the disk cavity (inside features A1 and A2, i.e., the gray-shaded area in Fig. 5), we achieve significantly lower contrast due to the coinciding disk structures. We can firmly rule out brown dwarf or low-mass stellar companions, but are not sensitive to massive gas giant planets.
We note that the presented detection limits do not take into account extinction effects. Given that the system is still young, it is conceivable that planets inside the disk cavity are (partially) enshrouded by circumplanetary material. This may to a lesser degree also be the case for planets outside of the disk. Extinction may lead to shallower detection limits than shown in Fig. 2. For a recent, detailed discussion of these effects we refer to Asensio-Torres et al. (2021).
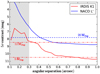 |
Fig. 5 Achieved contrast in the SPHERE K-band (red) and the NACO L-band (blue) observations. We indicate the contrast for 5 MJup and 12 MJup objects in K-band and a 20 MJup object in L-band. We used AMES-DUSTY models to convert the contrast to mass limits assuming a system age of 5 Myr. The gray-shaded area marks the inner cavity of the scattered light disk inside features A1 and A2. |
5 Discussion and conclusions
Our observations spatially resolve a disk around a T Tauri star in the Gum Nebula for the first time. We find a very extended disk out to at least 126 au with complex substructure. AT Pyx appears to be an exceptional system in more than one respect. Not only is it one of the few young stellar systems embedded in a cometary globule that still hosts a circumstellar disk, but also the radial extent of the disk is larger than expected for a disk that may be undergoing external photo-evaporation. Eisner et al. (2018) studied the mm emission of disks in the Orion Nebula Cluster (ONC), which is a high UV environment, and found that the majority of their sample showed outer radii smaller than 20 au. Masses in these disks are also typically small, with average values of ~3 MJup in the close vicinity (0.03 pc) of the Trapezium cluster (Eisner et al. 2008; Mann & Williams 2010; Mann et al. 2014). From our scattered light observations, we cannot draw direct conclusions about the mass of the disk surrounding AT Pyx. We note however that similar extended disks in scattered light have masses up to 50 times higher than the value reported for the photo-evaporated ONC disks (Garufi et al. 2018). The presence of such an extended and potentially massive disk might be explained by the young age of AT Pyx. Clarke (2007) found that disks should be significantly eroded by external photo-evaporation after 1–2 Myr. The age estimate of AT Pyx is only slightly older (~5 Myr). Given typical model uncertainties for the ages of young TTauri stars (e.g., Pecaut et al. 2012), it might be possible that AT Pyx is still younger and only now in the process of loosing its outer disk. However, we note that we only have indirect evidence that AT Pyx is indeed located in a field with high background radiation, the strongest of which is its location in the head of a cometary globule.
The substructure that we resolve shows two or possibly three spiral features. Following the discussion in the previous section, we consider feature S1 ambiguous. Spiral density waves in the gas are a common prediction for planets embedded in disks. Massive planets, with masses approaching the disk thermal mass or exceeding it, typically excite non-linear density waves and can thus drive multiple spiral arms (Goodman & Rafikov 2001; Rafikov 2002; Juhász et al. 2015; Dong et al. 2015; Bae et al. 2016). In particular, Zhu et al. (2015) and Fung & Dong (2015) find configurations with three spiral arms that are similar in appearance to the observations of AT Pyx. This typically requires planets at least more massive than Neptune (Dong & Fung 2017).
In scenario 1, which we outlined for the disk geometry, with a position angle of ~90°, we find that the disk must be eccentric. Such an eccentricity may also be well explained by an embedded massive planet. Zhang et al. (2018) ran an extensive grid of hydrodynamic models and found that for their higher mass planets (>1 MJup) and small disk aspect ratios at the planet position of h/r = 0.05 to 0.07, the planet opens a significantly eccentric gap in the gas (e > 0.15). As we trace micron-sized particles that are well coupled to the gas we can expect to trace such an eccentricity also in scattered light (Muro-Arena et al., in prep.). To estimate whether or not such a high planet mass may be consistent with our observations we used the relation between planet mass, spiral scattered light peak contrast, and aspect ratio found by Dong & Fung (2017). As feature S2 is the most unambiguous one, we measured its peak brightness near the launching point in the H-band polarized light data and compared it to the azimuthal average of the disk flux at the same separation. We find a spiral-to-disk contrast ratio of 2.29. Assuming aspect ratios of 0.05 and 0.07 and using equation 14 from Dong & Fung (2017) yields planet masses of 0.7 MJup and 1.1 MJup, respectively. This is well consistent with the required planet mass to open an eccentric gap. Due to the large distance of the AT Pyx system and the additional confusing disk signal, the thermal radiation of such a planet is unfortunately below our detection threshold.
Alternatively, if scenario 2 holds true with a disk position angle of 0°, then a strong misalignment of the inner and outer disks might also indicate the presence of a perturbing companion, which may be of planetary or stellar nature, similar as in the case of the disk around HD 142527 (Lacour et al. 2016; Price et al. 2018). A relative to the line of sight strongly inclined inner disk may also explain the strong optical variability of AT Pyx, especially if it is highly structured, such that dust clumps can occult the star. Given the location in the head of CG-22, it may also be possible that a relative disk misalignment between inner and outer disk is caused by material infall, similar to that recently inferred in the case of the SU Aur system (Ginski et al. 2021). In this case, it may be possible that the dynamic structures that we observe in the outer disk were also triggered by an infall event, without the need for a perturbing compact object.
The morphology of the AT Pyx system is intriguing and may well present the first detection of dynamic signs of ongoing planet formation in an externally photo-evaporated disk. To confirm this inference, ALMA observations in the submm are needed to determine the basic disk geometry and mass. Highresolution CO line observations may enable us to trace the kinematic signatures of the spiral features seen in scattered light. While a direct detection of the thermal radiation of the embedded planets is challenging with current ground- and space-based instrumentation, it may well be possible to observe accretion signatures, which can be more easily disentangled from disk scattered light (e.g., Haffert et al. 2019).
Acknowledgements
We would like to express our appreciation for the extraordinary contribution of the late France Allard to the field of exoplanet atmospheres. The model isochrones that we use in this study are a direct result of her work. This work has been supported by the project PRIN-INAF 2016 The Cradle of Life – GENESIS-SKA (General Conditions in Early Planetary Systems for the rise of life with SKA and PRIN-INAF 2019 “Planetary systems at young ages (PLATEA)”. This work has made use of data from the European Space Agency (ESA) mission Gaia (https://www.cosmos.esa.int/gaia), processed by the Gaia Data Processing and Analysis Consortium (DPAC, https://www.cosmos.esa.int/web/gaia/dpac/consortium). Funding for the DPAC has been provided by national institutions, in particular the institutions participating in the Gaia Multilateral Agreement. SPHERE was designed and built by a consortium made of IPAG (Grenoble, France), MPIA (Heidelberg, Germany), LAM (Marseille, France), LESIA (Paris, France), Laboratoire Lagrange (Nice, France), INAF – Osservatorio di Padova (Italy), Observatoire de Genève (Switzerland), ETH Zurich (Switzerland), NOVA (Netherlands), ONERA (France) and ASTRON (Netherlands) in collaboration with ESO. SPHERE was funded by ESO, with additional contributions from CNRS (France), MPIA (Germany), INAF (Italy), FINES (Switzerland) and NOVA (Netherlands). Additional funding from EC’s 6th and 7th Framework Programmes as part of OPTICON was received (grant number RII3-Ct-2004–001566 for FP6 (2004–2008); 226604 for FP7 (2009–2012); 312430 for FP7 (2013–2016)). We acknowledge the Programme National de Planétologie (PNP) and the Programme National de Physique Stellaire (PNPS) of CNRS-INSU, France, the French Labex OSUG@2020 (Investissements d’avenir – ANR10 LABX56) and LIO (Lyon Institute of Origins, ANR-10-LABX-0066 within the programme Investissements d’Avenir, ANR-11-IDEX-0007), and the Agence Nationale de la Recherche (ANR-14-CE33-0018) for support.
Appendix A SPHERE Polarimetrie images
In Figure A.1 we present the Stokes Q and U, as well as the derived Qϕ and Uϕ images. The flux calibration was carried out by measuring the flux of the central star in the noncoronagraphic flux calibration images, taken at the beginning and end of the observation sequence. To convert pixel counts to physical units we used the 2MASS H-band magnitude of AT Pyx as reference. The Uϕ image is showing very low flux levels compared to the Qϕ image, which indicates that the polarization signal is heavily dominated by single scattering of the light of the central star. This is expected for a circumstellar disk seen under a relatively low inclination, compatible with our analysis.
 |
Fig. A.1 SPHERE/IRDIS H-band Polarimetric images of AT Pyx. To highlight all features of the disk the color map is partially logarithmic, starting at 4 mJy / arc sec2. All images are shown on the same color scale. Images are aligned with true north up and east to the left. The gray hashed area marks the coronagraphic mask that was blocking the stellar light. |
Appendix B Cross identification of sub-structures
In order to better cross-identify substructures between the different observational data sets, we present contour overlays of the polarized light H-band data on top of the SPHERE K-band and NACO L-band total intensity data. The structures A1 and A2, as well as S1, S2, and S3 match closely in position and shape between the SPHERE data sets. The NACO data set has lower spatial resolution and contrast close to the star and does not detect features S1 or S3. It does detect the extended ring-like features A1 and A2. We note that feature A1 in the NACO data has a “forked” appearance on the northern end, which is similar to what is seen in the PDI contours and is there caused by the merging of feature S2 with feature A1. In that sense feature S2 might be regarded as marginally detected in the NACO data as well.
 |
Fig. B.1 SPHERE/IRDIS K-band image after ADI post-processing (same as in figure 3), shown in a logarithmic color map. The white over-layed contours are drawn from the SPHERE/IRDIS H-band Qϕ image after high-pass filtering (same data set as shown in figure 3). The contours associated with the features S1, S2, and S3, match closely in shape and position to the position of the same features as seen in total intensity. We note that we display the size of the H-band coronagraph with the gray hashed circle. |
 |
Fig. B.2 NACO L-band image after ADI post-processing (same as in figure 2), shown in a logarithmic color map. The white overlayed contours are drawn from the SPHERE/IRDIS H-band Qϕ image after high-pass filtering (same data set as shown in figure 3). The contours associated with the features Al and A2, match closely in shape and position to the position of the same features as seen in total intensity. |
Appendix C Simulated ADI on PDI data
To test whether the non detection of the features A1 and A2 in the IFS data might be a post-processing effect, we simulated classical ADI post processing on the IRDIS PDI H-band data. The result is shown in figure C.1. The ring-like features A1 and A2 are strongly suppressed because they extend predominantly in the azimuthal direction. The spiral-like features S1, S2, and S3 are to some degree visible in the data, but at low S/N. We note that a perfect match with the IFS data set is not to be expected because the IFS data show total intensity while we only use the polarized light as input for the simulation. Additionally, the noise characteristic of IRDIS and the IFS is fundamentally different because the IFS has a higher thermal background due to a lack of cooling. Nevertheless, it is clear that ADI post-processing strongly suppresses the ring-like features in the data.
 |
Fig. C.1 IRDIS H-band polarized light data set after post-processing by simulated classical ADI. For the field rotation during the ADI simulation the parallactic angles of the IRDIS K-band data set were used. The ring-like features Al and A2 are strongly suppressed. |
References
- Allard, F., Homeier, D., & Freytag, B. 2012, Phil. Trans. R. Soc. London Ser. A, 370, 2765 [Google Scholar]
- Amara, A. & Quanz, S. P. 2012, MNRAS, 427, 948 [NASA ADS] [CrossRef] [Google Scholar]
- Asensio-Torres, R., Henning, T., Cantalloube, F., et al. 2021, A&A, 652, A101 [NASA ADS] [CrossRef] [EDP Sciences] [Google Scholar]
- Avenhaus, H., Quanz, S. P., Schmid, H. M., et al. 2014, ApJ, 781, 87 [Google Scholar]
- Bae, J., Nelson, R. P., & Hartmann, L. 2016, ApJ, 833, 126 [NASA ADS] [CrossRef] [Google Scholar]
- Beuzit, J. L., Vigan, A., Mouillet, D., et al. 2019, A&A, 631, A155 [NASA ADS] [CrossRef] [EDP Sciences] [Google Scholar]
- Bhatt, H. C. 1993, MNRAS, 262, 812 [NASA ADS] [Google Scholar]
- Boccaletti, A., Abe, L., Baudrand, J., et al. 2008, SPIE Conf. Ser., 7015, 70151B [NASA ADS] [Google Scholar]
- Carbillet, M., Bendjoya, P., Abe, L., et al. 2011, Exp. Astron., 30, 39 [Google Scholar]
- Chauvin, G., Lagrange, A. M., Beust, H., et al. 2012, A&A, 542, A41 [NASA ADS] [CrossRef] [EDP Sciences] [Google Scholar]
- Choudhury, R., & Bhatt, H. C. 2009, MNRAS, 393, 959 [NASA ADS] [CrossRef] [Google Scholar]
- Clarke, C. J. 2007, MNRAS, 376, 1350 [NASA ADS] [CrossRef] [Google Scholar]
- Claudi, R. U., Turatto, M., Gratton, R. G., et al. 2008, SPIE Conf. Ser., 7014, 70143E [Google Scholar]
- Currie, T., Marois, C., Cieza, L., et al. 2019, ApJ, 877, L3 [Google Scholar]
- de Boer, J., Salter, G., Benisty, M., et al. 2016, A&A, 595, A114 [NASA ADS] [CrossRef] [EDP Sciences] [Google Scholar]
- de Boer, J., Langlois, M., van Holstein, R. G., et al. 2020, A&A, 633, A63 [NASA ADS] [CrossRef] [EDP Sciences] [Google Scholar]
- Delorme, P., Meunier, N., Albert, D., et al. 2017, in SF2A-2017: Proceedings of the Annual meeting of the French Society of Astronomy and Astrophysics, eds. C. Reylé, P. Di Matteo, F. Herpin, et al. [Google Scholar]
- Dohlen, K., Langlois, M., Saisse, M., et al. 2008, SPIE Conf. Ser., 7014, 70143L [Google Scholar]
- Dong, R., & Fung, J. 2017, ApJ, 835, 38 [Google Scholar]
- Dong, R., Zhu, Z., Rafikov, R. R., & Stone, J. M. 2015, ApJ, 809, L5 [Google Scholar]
- Eisner, J. A., Plambeck, R. L., Carpenter, J. M., et al. 2008, ApJ, 683, 304 [NASA ADS] [CrossRef] [Google Scholar]
- Eisner, J. A., Arce, H. G., Ballering, N. P., et al. 2018, ApJ, 860, 77 [CrossRef] [Google Scholar]
- Fung, J., & Dong, R. 2015, ApJ, 815, L21 [NASA ADS] [CrossRef] [Google Scholar]
- Gaia Collaboration (Brown, A.G.A., et al., 2018, A&A, 616, A1 [NASA ADS] [CrossRef] [EDP Sciences] [Google Scholar]
- Gaia Collaboration (Brown, A.G.A., et al., 2021, A&A, 650, C3 [NASA ADS] [CrossRef] [EDP Sciences] [Google Scholar]
- Galicher, R., Boccaletti, A., Mesa, D., et al. 2018, A&A, 615, A92 [NASA ADS] [CrossRef] [EDP Sciences] [Google Scholar]
- Garufi, A., Benisty, M., Pinilla, P., et al. 2018, A&A, 620, A94 [NASA ADS] [CrossRef] [EDP Sciences] [Google Scholar]
- Ginski, C., Stolker, T., Pinilla, P., et al. 2016, A&A, 595, A112 [NASA ADS] [CrossRef] [EDP Sciences] [Google Scholar]
- Ginski, C., Facchini, S., Huang, J., et al. 2021, ApJ, 908, L25 [NASA ADS] [CrossRef] [Google Scholar]
- Goodman, J., & Rafikov, R. R. 2001, ApJ, 552, 793 [NASA ADS] [CrossRef] [Google Scholar]
- Güdel, M., Lahuis, F., Briggs, K. R., et al. 2010, A&A, 519, A113 [CrossRef] [EDP Sciences] [Google Scholar]
- Haffert, S. Y., Bohn, A. J., de Boer, J., et al. 2019, Nat. Astron., 3, 749 [Google Scholar]
- Hawarden, T. G., & Brand, P. W. J. L. 1976, MNRAS, 175, 19P [NASA ADS] [CrossRef] [Google Scholar]
- Herczeg, G. J., & Hillenbrand, L. A. 2014, ApJ, 786, 97 [Google Scholar]
- Itoh, Y., Oasa, Y., Kudo, T., et al. 2014, Res. Astron. Astrophys., 14, 1438 [CrossRef] [Google Scholar]
- Jayasinghe, T., Stanek, K. Z., Kochanek, C. S., et al. 2019, MNRAS, 486, 1907 [NASA ADS] [Google Scholar]
- Juhász, A., Benisty, M., Pohl, A., et al. 2015, MNRAS, 451, 1147 [Google Scholar]
- Keppler, M., Penzlin, A., Benisty, M., et al. 2020, A&A, 639, A62 [NASA ADS] [CrossRef] [EDP Sciences] [Google Scholar]
- Kim, J. S., Walter, F. M., & Wolk, S. J. 2005, AJ, 129, 1564 [NASA ADS] [CrossRef] [Google Scholar]
- Lacour, S., Biller, B., Cheetham, A., et al. 2016, A&A, 590, A90 [NASA ADS] [CrossRef] [EDP Sciences] [Google Scholar]
- Lafrenière, D., Marois, C., Doyon, R., Nadeau, D., & Artigau, É. 2007, ApJ, 660, 770 [Google Scholar]
- Langlois, M., Dohlen, K., Vigan, A., et al. 2014, SPIE Conf. Ser., 9147, 91471R [Google Scholar]
- Launhardt, R., Henning, T., Quirrenbach, A., et al. 2020, A&A, 635, A162 [NASA ADS] [CrossRef] [EDP Sciences] [Google Scholar]
- Lenzen, R., Hartung, M., Brandner, W., et al. 2003, SPIE Conf. Ser., 4841, 944 [Google Scholar]
- Lindegren, L., Klioner, S. A., Hernández, J., et al. 2021, A&A, 649, A2 [EDP Sciences] [Google Scholar]
- Mann, R. K., & Williams, J. P. 2010, ApJ, 725, 430 [NASA ADS] [CrossRef] [Google Scholar]
- Mann, R. K., Di Francesco, J., Johnstone, D., et al. 2014, ApJ, 784, 82 [NASA ADS] [CrossRef] [Google Scholar]
- Marino, S., Perez, S., & Casassus, S. 2015, ApJ, 798, L44 [Google Scholar]
- Marois, C., Lafrenière, D., Doyon, R., Macintosh, B., & Nadeau, D. 2006, ApJ, 641, 556 [Google Scholar]
- Marois, C., Correia, C., Véran, J.-P., & Currie, T. 2014, IAU Symp., 299, 48 [NASA ADS] [Google Scholar]
- McCabe, C., Duchêne, G., & Ghez, A. M. 2002, ApJ, 575, 974 [NASA ADS] [CrossRef] [Google Scholar]
- McGinnis, P. T., Alencar, S. H. P., Guimarães, M. M., et al. 2015, A&A, 577, A11 [NASA ADS] [CrossRef] [EDP Sciences] [Google Scholar]
- Mesa, D., Gratton, R., Zurlo, A., et al. 2015, A&A, 576, A121 [NASA ADS] [CrossRef] [EDP Sciences] [Google Scholar]
- Milli, J., Mouillet, D., Lagrange, A. M., et al. 2012, A&A, 545, A111 [NASA ADS] [CrossRef] [EDP Sciences] [Google Scholar]
- Monnier, J. D., Harries, T. J., Bae, J., et al. 2019, ApJ, 872, 122 [Google Scholar]
- Pavlov, A., Möller-Nilsson, O., Feldt, M., et al. 2008, SPIE Conf. Ser., 7019, 701939 [Google Scholar]
- Pecaut, M. J., Mamajek, E. E., & Bubar, E. J. 2012, ApJ, 746, 154 [Google Scholar]
- Pettersson, B. 1987, A&AS, 70, 69 [NASA ADS] [Google Scholar]
- Price, D. J., Cuello, N., Pinte, C., et al. 2018, MNRAS, 481, 3169 [NASA ADS] [CrossRef] [Google Scholar]
- Rafikov, R. R. 2002, ApJ, 569, 997 [Google Scholar]
- Rodigas, T. J., Follette, K. B., Weinberger, A., Close, L., & Hines, D. C. 2014, ApJ, 791, L37 [Google Scholar]
- Rousset, G., Lacombe, F., Puget, P., et al. 2003, SPIE Conf. Ser., 4839, 140 [Google Scholar]
- Sahu, M., Pottasch, S. R., Sahu, K. C., Wesselius, P. R., & Desai, J. N. 1988, A&A, 195, 269 [NASA ADS] [Google Scholar]
- Schlafly, E. F., Green, G. M., Lang, D., et al. 2018, ApJS, 234, 39 [Google Scholar]
- Siess, L., Dufour, E., & Forestini, M. 2000, A&A, 358, 593 [Google Scholar]
- Soummer, R., Pueyo, L., & Larkin, J. 2012, ApJ, 755, L28 [Google Scholar]
- Stauffer, J., Cody, A. M., McGinnis, P., et al. 2015, AJ, 149, 130 [Google Scholar]
- van Holstein, R. G., Girard, J. H., de Boer, J., et al. 2020, A&A, 633, A64 [NASA ADS] [CrossRef] [EDP Sciences] [Google Scholar]
- Yamamura, I., Makiuti, S., Ikeda, N., et al. 2010, VizieR Online Data Catalog: II/298 [Google Scholar]
- Zhang, S., Zhu, Z., Huang, J., et al. 2018, ApJ, 869, L47 [Google Scholar]
- Zhu, Z., Dong, R., Stone, J. M., & Rafikov, R. R. 2015, ApJ, 813, 88 [Google Scholar]
We investigate why the ring-like features do not appear in the IFS data in Appendix C.
All Tables
All Figures
|
Fig. 1 Observed SED of AT Pyx based on photometric values (no de-reddening applied). The surveys from which measurements were taken are indicated by color coding. We note that the two longest wavelength AKARI data points may suffer from contamination, which may explain their discrepancy (Yamamura et al. 2010). |
| In the text | |
|
Fig. 2 Left: dark Energy Cam Plane Survey (DECaPS, Schlafly et al. 2018) optical multi-band image of the head of the cometary globule CG-22 in the Gum Nebula. The red dashed lines indicate the position of AT Pyx. Right from top to bottom: NACO L-band ADI image of the disk around AT Pyx; SPHERE K-band ADI image and SPHERE H-band polarized light image. |
| In the text | |
|
Fig. 3 Left: SPHERE/IFS image after angular differential imaging was applied to remove the stellar light component. Center: SPHERE/IRDIS K-band image after angular differential imaging. Right: SPHERE/IRDIS H-band image after polarization differential imaging. A high pass filter was applied to highlight high spatial frequency features and make the image more comparable to the K-band and the IFS images. We mark similar features in all three images with dashed lines for the “spiral-like” features S1-S3 and with continuous lines for the “arc-like” features A1 and A2. In the center panel, we specifically point out the discontinuity between features S1 and A1 in the north. We note that the flux calibrations are not absolute values due to the varying throughput of the different data processing methods (this also explains the negative flux values). They can be used to follow variations within each panel but are not comparable between panels. |
| In the text | |
|
Fig. 4 Schematic of the two scenarios to explain the scattered light features of the disk around AT Pyx. Scenario 1 (left) proposes an eccentric disk with a position angle of the major axis of 90°. Scenario 2 (right) proposes a circular disk with a position angle of 0° and a misaligned inner disk, which shadows the ansae of the visible outer disk. For both scenarios, we show a schematic of the actual view (top row) and of the de-projected top-down view (bottom row). |
| In the text | |
|
Fig. 5 Achieved contrast in the SPHERE K-band (red) and the NACO L-band (blue) observations. We indicate the contrast for 5 MJup and 12 MJup objects in K-band and a 20 MJup object in L-band. We used AMES-DUSTY models to convert the contrast to mass limits assuming a system age of 5 Myr. The gray-shaded area marks the inner cavity of the scattered light disk inside features A1 and A2. |
| In the text | |
|
Fig. A.1 SPHERE/IRDIS H-band Polarimetric images of AT Pyx. To highlight all features of the disk the color map is partially logarithmic, starting at 4 mJy / arc sec2. All images are shown on the same color scale. Images are aligned with true north up and east to the left. The gray hashed area marks the coronagraphic mask that was blocking the stellar light. |
| In the text | |
|
Fig. B.1 SPHERE/IRDIS K-band image after ADI post-processing (same as in figure 3), shown in a logarithmic color map. The white over-layed contours are drawn from the SPHERE/IRDIS H-band Qϕ image after high-pass filtering (same data set as shown in figure 3). The contours associated with the features S1, S2, and S3, match closely in shape and position to the position of the same features as seen in total intensity. We note that we display the size of the H-band coronagraph with the gray hashed circle. |
| In the text | |
|
Fig. B.2 NACO L-band image after ADI post-processing (same as in figure 2), shown in a logarithmic color map. The white overlayed contours are drawn from the SPHERE/IRDIS H-band Qϕ image after high-pass filtering (same data set as shown in figure 3). The contours associated with the features Al and A2, match closely in shape and position to the position of the same features as seen in total intensity. |
| In the text | |
|
Fig. C.1 IRDIS H-band polarized light data set after post-processing by simulated classical ADI. For the field rotation during the ADI simulation the parallactic angles of the IRDIS K-band data set were used. The ring-like features Al and A2 are strongly suppressed. |
| In the text | |
Current usage metrics show cumulative count of Article Views (full-text article views including HTML views, PDF and ePub downloads, according to the available data) and Abstracts Views on Vision4Press platform.
Data correspond to usage on the plateform after 2015. The current usage metrics is available 48-96 hours after online publication and is updated daily on week days.
Initial download of the metrics may take a while.