| Issue |
A&A
Volume 662, June 2022
|
|
|---|---|---|
| Article Number | A81 | |
| Number of page(s) | 17 | |
| Section | Interstellar and circumstellar matter | |
| DOI | https://doi.org/10.1051/0004-6361/202142990 | |
| Published online | 21 June 2022 | |
CRIRES high-resolution near-infrared spectroscopy of diffuse interstellar band profiles
Detection of 12 new DIBs in the YJ band and the introduction of a combined ISM sight line and stellar analysis approach★
1
Institut für Astro- und Teilchenphysik, Universität Innsbruck,
Technikerstr. 25/8,
6020
Innsbruck,
Austria
e-mail: [email protected]
2
Department of Astronomy and Astrophysics, University of Chicago,
5640 S Ellis Avenue,
Chicago,
IL
60637,
USA
3
Dr. Karl Remeis-Sternwarte & Erlangen Centre for Astroparticle Physics, Friedrich-Alexander-Universität Erlangen-Nürnberg,
Sternwartstr. 7,
96049
Bamberg,
Germany
4
LMU München, Universitätssternwarte,
Scheinerstr. 1,
81679
München,
Germany
5
European Southern Observatory,
Alonso de Cordova 3107, Vitacura, Casilla
19001
Santiago,
Chile
6
Laboratory for Astrophysics, Leiden Observatory, Leiden University,
PO Box 9513,
2300 RA
Leiden,
The Netherlands
Received:
23
December
2021
Accepted:
28
February
2022
Aims. A high spectral resolution investigation of diffuse interstellar bands (DIBs) in the near-infrared (YJ band) is conducted to test new methods, to confirm and improve existing parameters, and to search for new DIBs.
Methods. The CRyogenic high-resolution InfraRed Echelle Spectrograph (CRIRES) on the European Southern Observatory's Very Large Telescope was employed to obtain spectra of four reddened background supergiant stars (HD 183143, HD 165784, HD 92207, HD 111613) and an unreddened comparison star (HD 87737) at the highest resolution of R ≈ 100 000 currently achievable at near-infrared wavelengths, more than twice as high as accomplished in previous near-infrared DIB studies. The correction for telluric absorption was performed by a modelling approach. Non-local thermodynamic equilibrium spectral modelling of available optical and the new near-infrared stellar spectra facilitated a comprehensive characterisation of the atmospheric properties of the background stars. As a consequence, a more precise and accurate determination of the reddening and the reddening law along the respective sight lines could be achieved than feasible before by comparison of the observed and model spectral energy distributions. For DIBs that overlap with stellar lines the DIB profile shapes could be recovered.
Results. Seventeen known near-infrared DIBs were confirmed, and 12 previously unknown and generally weaker DIBs were identified in the YJ band. Three DIBs that show uniform profiles along all sight lines were identified, possibly connected to transitions from a common lower state of the same carrier. The divergent extinction curve towards the frequently discussed DIB standard star HD 183143 could be reproduced for the first time, requiring extra absorption by ~3.5 mag due to polycyclic aromatic hydrocarbons (PAHs) to match the ultraviolet extinction bump. This extra absorption probably stems from a circumstellar bubble lying in front of the star which is intersected tangentially by the line of sight, making this particular sight line more peculiar than standard.
Key words: dust, extinction / ISM: lines and bands / ISM: molecules / line: profiles / stars: early-type / supergiants
DIB spectra is only available at the CDS via anonymous ftp to cdsarc.u-strasbg.fr (130.79.128.5) or via http://cdsarc.u-strasbg.fr/viz-bin/cat/J/A+A/662/A81
© A. Ebenbichler et al. 2022
 Open Access article, published by EDP Sciences, under the terms of the Creative Commons Attribution License (https://creativecommons.org/licenses/by/4.0), which permits unrestricted use, distribution, and reproduction in any medium, provided the original work is properly cited.
1 Introduction
Diffuse interstellar bands (DIBs) are absorption features that have been reported in the spectra of reddened stars in the Milky Way since their first detection by Heger (1922). They are caused by material populating the diffuse interstellar medium (ISM) and grow in strength with increasing extinction. The DIBs are ubiquitous in sight lines towards background sources within the Galactic disc, except for nearby stars (for a review of the development of the field see Snow 2014). They have also been found in nearby dust-harbouring irregular and spiral galaxies (e.g. Ehrenfreund et al. 2002; Cordiner et al. 2008a,b), more distant dusty starburst galaxies (Heckman & Lehnert 2000), and a damped Lya system at redshift 0.524 (Junkkarinen et al. 2004).
The carriers of DIBs are thought to be large carbonaceous molecules (from several tens up to ~ 100 atoms) in the gas phase (Herbig 1995; Tielens 2014). It is challenging to identify the carriers of DIBs given the overwhelming number of potential candidates (see e.g. Omont 2016; Omont et al. 2019, for a discussion). Over 550 DIBs have been found so far (Fan et al. 2019), and only 4 DIBs (λλ9365, 9428, 9577, 9632 Å) have an unambiguously identified carrier, which is the buckminster-fullerene cation  (e.g. Campbell et al. 2015; Spieler et al. 2017; Cordiner et al. 2019).
In the absence of direct identifications of DIB carriers, many indirect clues have been collected, providing numerous constraints on their nature. Many studies have established DIB families, groups of DIBs that behave in a similar manner, based on correlations of their respective equivalent widths (EWs; e.g. Krelowski & Walker 1987; Cami et al. 1997). The λλ6614 and 6196 Å DIBs show the highest EW correlation of any optical DIB pair known to date (McCall et al. 2010). There have been several studies on both members of this pair including profile studies at very high spectral resolving power (R = λ/Δλ = 600000, Sarre et al. 1995), finding substructures. McCall et al. (2010) conclude that the DIB pair λλ6614, 6196 Å is not certain to have the same carrier because they have different band profiles, which should be very similar if the DIBs arise from transitions from the same molecular ground state. However, the carriers should share a common chemical history. Substructures in DIB profiles are believed to arise from unresolved P-, R-, and Q-branches of molecular transitions (McCall et al. 2010).
A study of the special subclass of C2-DIB profiles in the optical was conducted by the ESO Diffuse Interstellar Bands Large Exploration Survey (EDIBLES, Cox et al. 2017; Elyajouri et al. 2018) at R ≈ 70 000-100 000. They resolved DIBs with substructure, interpreted as rotational P(Q)R-branches of molecular carriers. Differences in the relative amplitudes of the peaks and peak substructure separations for the same sight lines imply that the C2-DIBs arise from different molecular carriers of different sizes. Some of the DIBs showed constant separation of the absorption subpeaks, while others potentially showed variations or global broadening in response to varying C2 temperatures.
Most of the DIB analyses to date have concentrated on the optical wavelength range. The discoveries of DIBs in the near-infrared (NIR, Joblin et al. 1990; Foing & Ehrenfreund 1994; Groh et al. 2007; Geballe et al. 2011; Cox et al. 2014; Hamano et al. 2015; Galazutdinov et al. 2017) opened up new possibilities for DIB studies because of the significantly lower transition energies than in the optical, shifting the focus from electronic to ro-vibrational transitions. This wavelength region is also less dense in DIBs which decreases the chance of coincidental overlaps. At the same time, the survey of the 15 273 Å DIB within the Apache Point Observatory Galactic Evolution Experiment (APOGEE) by Elyajouri & Lallement (2019) produced a Galactic overview of DIB absorption at high spectral resolution (R = 22 500) for the first time, covering over 124 000 sight lines. Studies of NIR DIBs in the past decade profited from the rapidly increasing spectral resolution of the available instrumentation, from R ≈ 10 000 with X-shooter in the mini-survey of Cox et al. (2014), over R ≈ 28 000 with the Warm INfrared Echelle spectrograph to Realize Extreme Dispersion and sensitivity (WINERED) in the study of Hamano et al. (2015) to R ≈ 45 000 with the Immersion Grating INfrared Spectrograph (INGRIS) achieved in the work of Galazutdinov et al. (2017).
Besides correlations of DIB EWs with each other, relations of DIB EWs to other ISM tracers have been investigated, including the H I or H2 column density, the presence of simple diatomic molecules (like C2, see above), and the dependency on the ultraviolet (UV) radiation field along the sight lines. Most commonly discussed is the general correlation with dust column density, typically reduced to extinction AV or colour excess E(B-V) for practical purposes, with the total-to-selective extinction ratio RV = AV/E(B-V) parametrising an average extinction law (Cardelli et al. 1989). The accurate and precise determination of the wavelength-dependent extinction is consequently of great importance for DIB studies. Traditionally, the colour excess and extinction law are derived by comparing colours and the spectral energy distribution (SED) of reddened objects with those of unreddened identical standard stars, known as the pair method (e.g. Massa et al. 1983). This possibly introduces systematic uncertainties in the analyses, for example because of spectral-type mismatch or unrecognised binarity of objects, which is particularly high among early-type stars (with a high fraction of similar-mass binary components). Thus, the use of stellar atmosphere models and synthetic SEDs to derive extinction curves (e.g. Fitzpatrick & Massa 2005) is to be preferred.
Typically, OB-type stars are employed as background stars for studying DIBs. The reasons are their high luminosities, near-continuous spectra with only few stellar features, and fast rotation, which allow DIBs to be easily identified and measured. In contrast, the focus here is on supergiants of spectral types late B to early A. Compared to OB-type stars they have low bolometric corrections and rather flat SEDs throughout the optical and near-IR (i.e. their very high luminosity is concentrated at wavelengths with DIBs). BA-type supergiants therefore facilitate longer sight lines to be covered at the same background star magnitudes. This allows higher reddening values to be reached, which is an advantage for the search for new (intrinsically weaker) DIBs. On the other hand, they are slow rotators, and show spectra richer in stellar lines than OB-stars; however, this is not problematic for DIB studies if the stellar spectra are understood well. As BA-type supergiants are among the visually brightest stars in actively star-forming galaxies (e.g. Kudritzki et al. 2008) they will become primary targets for future DIB studies in nearby galaxies, already accessible today to intermediate-resolution spectroscopy with 8-10 m class telescopes out to distances of 7-8 Mpc (Bresolin et al. 2001; Kudritzki et al. 2013, 2014).
In the present work a study of NIR DIBs at more than double the spectral resolution reported so far is presented, finally reaching the contemporary standard set at optical wavelengths. Likewise, an improved characterisation is presented of the background stars' properties based on models that account for deviations from the standard assumption of local thermodynamic equilibrium (LTE), known as non-LTE models, which in turn allows properties of the ISM sight lines like reddening and reddening law to be constrained to unprecedented accuracy and precision. We describe the observation and reduction of our NIR and optical spectra in Sect. 2 and the quantitative analysis of the background stars in Sect. 3, including the comparison of the model with the observed SEDs. The methods for the analysis of the velocity components of the ISM along the sight lines and for DIB measurements (plus a brief comparison with previous measurements) are discussed in Sects. 4 and 5. New NIR DIBs are introduced in Sect. 6 and we present a set of DIBs with common absorption profiles in Sect. 7. Finally, a brief summary is given and conclusions are drawn.
2 Observations and data reduction
Basic information on the observational sample is summarised in Table 1: the spectral type, Johnson V and J magnitudes from the Two Micron All Sky Survey (2MASS), the Johnson B–V colour, the observing logs, observation dates, exposure times, and signal-to-noise ratio per pixel S/N achieved for the spectra, both for the NIR and our complementary optical observations. The table is ordered by colour excess of the target stars (see below), from high to low. The first four (reddened) stars were employed for DIB measurements in the present work. The nearby supergiant HD 87737 is located at a high Galactic latitude and is thus practically unreddened with a colour excess of E(B–V) = 0.02. It therefore served as an unreddened reference star in the present work for the confirmation of DIBs and the identification of stellar absorption lines. This was possible because of the relatively narrow spectral range of B7 to A2 covered here, with HD 87737 an A0-type star conveniently situated in the middle.
Colour composites of images obtained by the Wide-field Infrared Survey Explorer (WISE) are shown in Fig. 1 that allow the ISM environment of the DIB target stars to be visualised. The star HD 92207 lies on a sight line towards the HII region IC 2599, which is powered by OB stars in the young open cluster NGC 3324, whereas the other three stars appear to be located on diffuse ISM sight lines (but see below for further discussion).
The NIR spectra analysed in this work were obtained with the CRyogenic high-resolution InfraRed Echelle Spectrograph (CRIRES, Käufl et al. 2004) on the European Southern Observatory (ESO) Very Large Telescope (VLT) Unit Telescope 1 (UT1) at Cerro Paranal, Chile. The spectrograph provided a resolving power of up to R ≈ 100 000, depending on slit width, and made observations within a wavelength range ~0.95-5.2 μm possible. A single instrumental setting covered a narrow wavelength range (~λ/70), and was recorded on four detector chips, yielding four disconnected spectral pieces per exposure. However, because of order overlap on chips 1 and 4 in the YJ bands, only spectra recorded on chips 2 and 3 were employed for the further analysis. A near-continuous wavelength coverage was achieved by choosing adjacent instrumental settings. Coverage of an entire spectroscopic NIR band therefore required approximately 70 wavelength settings to be taken.
The data were obtained during two observing runs, in one of the first visitor-mode runs in 2007 when CRIRES was offered to the community by ESO for the first time and in one of the last service-mode observing runs in 2014 before CRIRES was removed from the VLT-UT1 for upgrade. The data reduction was performed close to the time of the observations for both datasets, thus it is optimised to the status of the instrument at the time of observation; the instrument was subject to many smaller interventions in between.
Data for HD 87737, HD 92207, and HD 111613 were obtained without adaptive optics (AO) support within a programme on benchmark spectroscopy of NIR stellar features of bright A-type supergiants with a 0.2″ slit (i.e. at a nominal R ≈ 100000). The wavelength coverage of the YJ band was incomplete. As a consequence, several previously reported NIR DIBs are not covered by these data. The signal-to-noise ratio per pixel was S/N ≈ 200-300.
Basic data reduction followed the standard recipes for long-slit IR spectrographs. Observations were always performed in a single AB nodding pattern for all wavelength settings. All raw frames were treated with a non-linearity correction before pairwise subtraction removed the atmospheric emission features. The individual A–B and B–A frames were then divided by a normalised flat field. The flat-fielding step corrected the pixel-to-pixel gain variations of the chips, but due to repeatability problems of the intermediate slit of CRIRES this step influenced the slope of the continuum in most spectra, which had to be corrected in a final step of the data reduction. An ESO Recipe Execution Tool (EsoRex) of the CRIRES data reduction pipeline was used for optimal extraction of the 1D spectrum in each nodding position. The two 1D spectra of each set-up and target combination were then cross-correlated to identify offsets in wavelength due to the slit curvature, shifted accordingly and co-added. In this step the imprints of optical ghosts that were present in one of the two nodding position in most YJ band settings were removed, and cosmetic artefacts and outliers were filtered by an iterative procedure.
The telluric absorption lines still contained in the processed 1D spectra could not be removed by dividing by the spectrum of an early-type standard star since this would have compromised the intrinsic features of the targets. Instead, the telluric features were modelled using the Fast Atmospheric Signature CODE (FASCODE, Clough et al. 1981, 1992), a line-by-line radiative transfer code for the Earth's atmosphere, and the HIgh-resolution TRANsmission molecular absorption database (HITRAN, Rothman et al. 2005). Global Data Assimilation System (GDAS) atmospheric profiles were used as input for FASCODE and delivered the necessary information for temperature, pressure, and humidity as a function of height in the atmosphere. The profiles were retrieved from the National Oceanic and Atmospheric Administration's (NOAA) website1 for the two nights of observations. The amount of precipitable water vapour predicted by the models was adapted to achieve an optimal fitting in comparison to the measurements. The resulting spectra were smoothed with a Gaussian kernel to match the resolution of the science spectra. In a final step the telluric absorption features were then removed by dividing the science spectra by the model spectra. A detailed discussion of the performance and limitations of this particular approach for telluric correction is given by Seifahrt et al. (2010).
The significantly reddened supergiant targets HD 165784 and HD 183143 were observed at a nominal R ≈ 100000 covering a spectral range between 9550 and 13 450 Å. A S/N ≈ 200–500 per pixel was achieved in no-AO mode. The raw data were reduced using the CRIRES data reduction pipeline (Jung 2014) in a way similar to that described above, but using the version that was adapted to the instrument at the time of observation. The spectra were corrected for telluric absorption using Molecfit (Smette et al. 2015; Kausch et al. 2015), which follows a modelling approach similar to FASCODE. The precipitable water vapour was determined between 1 and 2 mm by Molecfit for most settings.
In addition, complementary optical spectra observed with the Fibre Optics Cassegrain Echelle Spectrograph (FOCES, Pfeiffer et al. 1998) on the Calar Alto 2.2 m telescope in Spain (R = 40000) for HD 183143 and with the Fibre-fed Optical Echelle Spectrograph (FEROS, Kaufer et al. 1999) on the ESO/MPG 2.2 m telescope at La Silla/Chile (R = 48 000) for the other targets were used (see Table 1). Data reduction for HD 183143 was performed in the same way as for the FOCES observations discussed by Firnstein & Przybilla (2012), and the reduction of the raw data for the other stars was performed as described by Przybilla et al. (2006). These spectra were used for optical DIB measurements and for measurement of the velocity dispersion of interstellar absorbers based on K I lines.
To construct the stellar SEDs, flux-calibrated, low-dispersion, and large aperture (10″×20″) spectrophotometry by the International Ultraviolet Explorer (IUE) were extracted from the Mikulski Archive for Space Telescopes (MAST2): data IDs SWP06550 and LWR05637 for HD 183143, SWP43216 and LWP21843 for HD 92207, and SWP08566 and LWR07305 for HD 87737. If IUE data were not available (as was the case for HD 165784 and HD 111613) UV magnitudes from the Astronomical Netherlands Satellite (ANS) UV Catalogue of Point Sources (Wesselius et al. 1982) were adopted. These data were supplemented by Johnson UBV magnitudes from Mermilliod (1997), JHK magnitudes from 2MASS (Cutri et al. 2003; Skrutskie et al. 2006), and infrared (IR) magnitudes from the WISE All-Sky Data Release (Cutri & et al. 2012).
Contamination of the SEDs by other nearby objects can be excluded. An OB-type main-sequence star within the IUE aperture would reveal its presence by an unaccounted UV rise, anything else is outshone by the BA-type supergiant that concentrates the integrated luminosity of a globular cluster or even of a dwarf galaxy into a point source.
The observational star sample.
 |
Fig. 1 WISE imaging (1° × 1°) of the ISM in the sight lines towards the target stars, from left to right: HD 183143, HD 165784, HD 92207 and HD 111613. Colour code: Red (W4, 22 μm), green (W2, 4.6 μm), blue (W1, 3.4 μm). The target stars are centred and indicated by a cross. |
3 Quantitative analysis of background stars
A thorough physical characterisation of the background stars of interstellar sight lines including the calculation of complete synthetic spectra is highly beneficial, not to say a prerequisite, for DIB studies. First, the synthetic SEDs allow extinction curves to be determined in the best possible way, thus minimising systematic errors. Second, this allows the pure DIB profiles of features that are (fully) blended with stellar lines to be recovered. Background sources are typically selected among early-type stars for various reasons: relatively line-free spectra; continuum fluxes at optical wavelengths that reflect the Rayleigh-Jeans tail of the SEDs; high luminosities that render the stars bright even over kiloparsec distances, even more so when considering giants and supergiants in addition to the more frequent main-sequence stars. However, quantitative analyses of early-type stars require non-LTE techniques to be applied because of the intense radiation fields, and hydrodynamical model atmospheres for the most luminous objects to account for strong mass outflow.
3.1 Model atmospheres and spectral analysis
A determination of a number of atmospheric parameters is required for a thorough description of the background star: the effective temperature Teff, surface gravity g, microturbulence ξ, macroturbulence ζ, projected rotational velocity v sin i, helium abundance (by number) y, and elemental abundances log εx = log N(X)/N(H) + 12, where N(X) is the number density of element X and N(H) the number density of hydrogen. To do this, an inverse problem needs to be solved: finding the correct parameters that allow the observed spectrum to be reproduced.
A hybrid non-LTE approach was employed. Line-blanketed hydrostatic model atmospheres were calculated with the ATLAS 9 code (Kurucz 1993) under the assumption of LTE. These were complemented by non-LTE line-formation calculations performed with updated and extended versions of DETAIL and SURFACE (Giddings 1981; Butler & Giddings 1985). The coupled radiative transfer and statistical equilibrium equations were solved iteratively with DETAIL, which provided non-LTE level populations, and the formal solution was computed based on these with SURFACE, which furthermore employed refined line-broadening theories. Synthetic spectra were compared to observations aiming at χ2 minimisation, and the physical stellar parameters were adjusted in an iterative way to improve the fit. The main spectral diagnostics were temperature-sensitive metal ionization equilibria (requiring that abundances derived from different ionization stages of an element agree) and gravity-sensitive Stark-broadened hydrogen lines. Further constraints came from the match between the observed and model SEDs, and from luminosity constraints based on distances. Further details of the analysis methodology for applications to BA-type supergiants are discussed by Przybilla et al. (2006), with some refinements introduced later by Firnstein & Przybilla (2012).
Results for the basic atmospheric parameters of the sample stars are summarised in Table 2. For each object the HD number is listed, along with its spectral type; the effective temperature; the logarithm of the surface gravity; the surface helium abundance; and the microturbulent, macroturbulent, and projected rotational velocities, all with their uncertainties. Furthermore, spectroscopic distances dspec (calculated according to Eq. (1) of Nieva & Przybilla 2012), distances from the inversion of the Gaia Early Data Release 3 (EDR3, Gaia Collaboration 2016, 2021) parallax, and the derived E(B–V) and RV values from a comparison of observed and model SEDs (see below) are also summarised in Table 2. In addition, the ISM sight line type is stated. Table 3 lists non-LTE elemental abundances for those chemical species that contribute almost all observed stellar lines in the analysed NIR bands. References to the model atoms used for NIR line-formation calculations are also tabulated. The model atoms of Przybilla & Butler (2004) and Przybilla (2005) were employed for hydrogen and helium, respectively.
It should be noted that the modelling approach presented here is applicable to a wide variety of early-type stars that are used as background objects to investigate interstellar lines of sight. It was successfully applied for the analysis of normal early B-type stars (Nieva & Przybilla 2007, 2012, 2014) as well as chemically peculiar B-type stars (Przybilla et al. 2008, 2016, 2021; Maza et al. 2014), and for spectroscopic binary or multiple early-type systems (González et al. 2017, González et al. 2019). Limitations are set at high luminosities, for O-type stars and early B-type super-giants above ~30 M⊙, where pronounced mass outflow occurs and the intense radiation field gives rise to significant non-LTE effects on the atmospheric structure, both of which cannot be realistically handled by a hydrostatic hybrid non-LTE approach.
Parameters of the sample stars and ISM sight line characterisation.
Non-LTE abundances of the sample stars.
 |
Fig. 2 Importance of non-LTE effects. Left panel: comparison of synthetic line profiles for the Mg II λ9632 Å blend to DIB λ9632Å in HD 165784, for the average magnesium abundance derived for the star: non-LTE (solid line), LTE (dashed line), LTE profile for an adjusted abundance that allows the non-LTE EW to be reproduced (dotted line: identical to the solid line in this case). The profiles were convolved with the appropriate broadening functions for the star. Right panel: same as in the left panel, but for He I λ11970 Å blend to DIB λ 11970 Å, for HD 183143 (see text for discussion). |
3.2 Stellar blends
Diffuse interstellar bands may be blended with telluric lines and with stellar absorption lines. A correction can be performed in analogy to the telluric case, by dividing the observed spectra with appropriate synthetic spectra. The importance of accounting for non-LTE effects in the line formation calculations is shown in Fig. 2 for two exemplary cases of stellar lines that typically blend with DIBs: a Mg II line that overlaps with one of the stronger  DIBs (Lallement et al. 2018) and a He I line that overlaps with one of the DIBs reported here for the first time. Non-LTE effects are very strong in both cases, increasing the EWs of the lines by factors of 2–3, with our non-LTE models being able to reproduce observations. While the profile of the Mg II line could in principle be closely reproduced in LTE by increasing the magnesium abundance until the EWs match, this is not possible in the case of the He I line. Reliable and well-tested non-LTE models are therefore mandatory to recover the intrinsic DIB profiles. Two examples of the procedure on the observed spectrum of HD 183143 and HD 165784 are shown in Fig. 3. The broad
  DIB λ9632 has a shallow but symmetrical profile after correction for the stellar Mg II line. The He I line is much stronger than the DIB, and it will dominate even more for earlier spectral types, which explains why the DIB has not been reported previously. This He I blend is important only for HD 183143 and HD 92207 among our reddened sample stars; the two other supergiants (and HD 87737) are too cool to excite this line, thus unambiguously confirming the new DIB at this wavelength.
The correction for stellar blends with hydrostatic non-LTE models is also limited for objects like the sample supergiants. Some NIR hydrogen lines are affected by the stellar winds, similarly to some of the Balmer lines, such that the feasibility of corrections of DIB profiles for hydrogen line blends needs to be decided on a case-by-case basis.
 |
Fig. 3 Correction of the band profile of DIB λ9632 in HD 165784 and DIB λ11970 in HD 183143. Displayed are the observed spectrum (dashed black line); the synthetic spectrum (blue line) of the Mg II line of the background star HD 165784; the He I line of the background star HD 183143 and the corrected spectrum, i.e. the observed spectrum divided by the stellar spectrum, showing the DIB (red line). Wavelengths and wavenumbers are given in the barycentric rest frame. |
3.3 Extinction curves
The ISM is not homogeneous in the Milky Way and shows variations in gas and grain composition, the local radiation field and turbulence. These variations can manifest themselves in modifying DIB characteristics and also in the shape of the extinction law, which depends on the interstellar dust composition.
The total-to-selective extinction ratio RV was shown to correlate with some normalized DIB EWs (EW per unit extinction AV; Ramírez-Tannus et al. 2018) because it depends on the composition of the diffuse ISM. Therefore, a meaningful characterisation of an interstellar sight line requires the individual determination of E(B–V) and of RV, instead of adopting a standard value RV = 3.1. For the present work, an approach was selected in which the model SED for the parameters determined from the quantitative spectroscopic analysis was reddened using the Cardelli-Clayton-Mathis (CCM) extinction law (Cardelli et al. 1989) for a comparison with the observed SED. Best fits for the targets HD 165784, HD 92207, HD 111613, and HD 87737 were obtained for the E(B- V) and RV values summarised in Table 2. The fits are displayed for the three reddened stars in Fig. 4. Reddened SEDs are compared to photometric magnitudes, and if available IUE data are used for the UV-bump. Only the cases of HD 92207 and HD 183143 require some further discussion.
 |
Fig. 4 Measurements of three sample star SEDs, compiled from IUE data (black curve) and photometric data (boxes). The CCM extinction law was employed to redden the synthetic ATLAS9 SEDs of the background stars (red); see text for discussion. |
HD 92207
The sight line towards HD 92207 appears complicated even at a first glance (see Fig. 1). The crucial question is whether the star is a foreground object to the open cluster NGC 3324 and its surrounding H II region IC 2599, a member, or even a background object. A recent analysis of cluster members based on Gaia EDR3 data finds a distance of 2.8 ± 0.2 kpc to NGC 3324 (Bisht et al. 2021). The distance to HD 92207 is more difficult to constrain; the Gaia EDR3 parallax implies a short distance of 2.1 ± 0.3 kpc, while the spectroscopic distance of 3.1 ± 0.5 kpc (see Table 2) is compatible with the open cluster distance. This would correspond to bolometric magnitudes Mbol of about -8.3 mag for the short distance and about −9.1 mag for the long distance. However, HD 92207 is one of the most luminous BA-type supergiants known in the Milky Way, more luminous than Deneb (Mbol ≈−8.5 mag, Schiller & Przybilla 2008) because of the much higher mass-loss rate, as evidenced by the highly pronounced Hα P Cygni profile (Kaufer et al. 1996). It therefore appears that HD 92207 may indeed be spatially close to the cluster NGC 3324 (implying that an unaccounted systematic error may trouble the Gaia parallax), which is further corroborated by a consistent colour excess, 0.48 ± 0.03 mag versus 0.45 ± 0.05 mag for the cluster (Bisht et al. 2021). Our RV value of 3.9 is also consistent with a sight line traversing an H II region, where values larger than the canonical value of 3.1 are typically realised. The observed flux excess for this star in the WISE bands can be attributed to the high infrared luminosity of the H II region (see Fig. 1).
 |
Fig. 5 Comparison of the measured (black) and model SEDs for HD 183143. Two model solutions are shown: Application of the CCM extinction law to the ATLAS9 SED with E(B–V) = 1.02 and RV = 3.8 (dashed blue line) and a modification by employing SKIRT to introduce additional extinction by a PAH component, including secondary emission (red line). With the additional PAH component extinction, values of E(B–V) = 1.22 and RV = 3.3 are required to obtain a near-perfect fit to the observed SED. |
HD 183143
Unlike the other four stars, no reasonable fit of the observed SED could be achieved using the CCM extinction law in the case of the DIB standard star HD 183143. As shown in Fig. 5, a fit with E(B–V) = 1.02 and RV = 3.8, which matches the SED for ≳5000 Å, fails to reproduce the strong extinction shortwards, overpredicting the flux by about two orders of magnitude in the 2175 Å extinction bump. The colour excess is also incompatible with a value derived from considering an intrinsic (B–V) colour from the spectral-type, which yields E(B–V) = 1.27 for HD 183143 (Hobbs et al. 2009). It is well documented that the sight line towards HD 183143 shows two roughly equally strong interstellar absorption components (see also Hobbs et al. 2009). A tentative approach to modelling the extinction curve by overlapping two distinct CCM-type extinction laws also yielded no success. In order to solve this discrepancy for this highly important object in the context of DIB investigations, a more refined approach is required.
We used the non-LTE radiative transfer code SKIRT (Baes et al. 2011; Camps & Baes 2015) to model dust absorption in a 3D Monte Carlo simulation. The code allows different species, such as graphitic and silicate dust, and polycyclic aromatic hydrocarbons (PAHs) to be considered in detail. The HD 183143 extinction curve can be reproduced closely using a combination of the CCM extinction law and an additional PAH absorption component, for a combined E(B–V) = 1.22 and RV = 3.3 (see Fig. 5). The peculiar ISM is represented by a slab with uniform PAH density extending over 2 pc along the sight line, approximated to the observed geometry (see below). The scattering process is modelled by the Henyey-Greenstein phase function (Henyey & Greenstein 1941), which does not consider polarization. The optical properties are those of neutral PAH carbonaceous grains according to Li & Draine (2001). Calorimetric properties are approximated by the analytical enthalpy prescription for graphite (Li & Draine 2001) with a bulk mass density set to the standard value of 2240 kg m−3 for graphite grains. The grain size distribution is adapted from model BARE_GR_S of Zubko et al. (2004) with a minimum grain size of amin = 3.5 Å and a maximum grain size of amax = 50 Å. We normalised the overall material density to an optical depth of τ(2175 Å) = 3.2, which is equivalent to a PAH mass column density of 6.05 × 10⁻⁵ kg m−2.
The search for a source of PAH-rich material resulted in finding a bubble in the W3 and W4 bands with lower luminosity than the ambient ISM in the general direction towards HD 183143, which is enclosed by a more luminous shell. Figure 6 shows images of this shell in the WISE 3 and 4 bands along with the extents of its major and minor axes. The sight line to HD 183143 intersects this shell tangentially, providing a potentially significant column mass of absorbing material at optical-NIR wavelengths. The object at the centre of the bubble is the H ≈ 19.8 mag IR source IRAS 19255+1816, for which the only additional data available in the literature are flux measurements with the Infrared Astronomical Satellite (IRAS, Helou & Walker 1988), which indicate a rise in flux towards 100 μm.
The shell is likely associated with the +4kms−1 (barycentric) absorption component in the spectrum of HD 183143, which shows CN (Hobbs et al. 2009). This hints at a carbon-rich circumstellar envelope (i.e. to a carbon-star nature for IRAS 19255+1816). The shell has a semi-major axis extension of a ≈ 6.7 arcmin and a semi-minor axis of b ≈ 5.2 arcmin. At a tentative distance of dshell ~ 2 kpc this would translate to a ≈ 3.9 pc and b ≈ 3 pc. The luminosities of the shell in the W3 and W4 bands also support a localised PAH overabundance in this sight line because these band wavelengths match those of PAH emission bands (Li & Draine 2001; Siebenmorgen et al. 2014), as well as the improved fit of the extinction curve (Fig. 5). So if some DIBs show stronger normalised equivalent widths in this sight line compared to other DIBs, those DIBs should have a higher probability of having PAHs as carriers.
It would, in general, be very interesting to observe more sight lines with PAH overabundances to circumvent the degeneracy of those effects when only looking at a single example. For this particular shell it would be valuable to test other sight lines that pass the shell tangentially. Unfortunately, all candidate stars are much fainter, with little information available in the literature, and the few brighter among them are low-luminosity foreground stars. Finally, it would be beneficial to investigate further the supposed central object of the circumstellar shell, IRAS 19255+1816, to constrain its nature.
4 Atomic interstellar lines: Cloud velocities
The sight lines were analysed for multiple cloud components and radial velocities RV as these are important details for the interpretation of the measured DIB profiles. All sight lines towards reddened target stars show two interstellar cloud components, which were consequently fitted by a two-Gaussian model to the interstellar K I absorption line at λair = 7698.965 Å (Kramida et al. 2019)3. The fitting results are summarised in Table 4 and displayed in Fig. 7. We always label the local component with the lower absolute RV as component 1 and the other component as component 2. For each component RVs are given in the barycentric rest frame RVbc and in the local standard of rest (LSR) RVLSR, with the transformation made using the solar peculiar velocity from Schönrich et al. (2010). Furthermore, the velocity difference between the two components |ΔRV| and the RV of the background stars from our own measurements is given in Table 4. The last two entries are the EWs of the K I absorption components. The |ΔRV| is smaller than 17 km s−1 for all sight lines, so we consider all structures within DIB profiles on a scale larger than 17 km s−1 as intrinsic band profile characteristics. Figure 7 (upper row) shows the Gaussian fits of the K I lines, along with the respective Na I D1 lines (lower row), which were not fitted due to their strong saturation. The absorption components are labelled. We note that for HD 87737 there is no interstellar K I component observable because the star is located at a high Galactic latitude and it is relatively close to the Earth.
We attribute the K I components to different spiral arms of the Milky Way. Component 1 is always the Local Arm component due to its lower absolute RV. We used the observed spiral structure of the Milky Way according to Hou & Han (2014) to assign the second component; this is discussed in the following.
The sight line to HD 183143 at Galactic longitude ℓ ≈ 53° shows the second component redshifted with respect to RV1,LSR. We attribute this component to a circumstellar shell (Sect. 3.3) that is presumably close to the Sagittarius Arm. The assignment for HD 165784 at ℓ ≈ 9° is similar, with a redshifted RV2,LSR implying membership of component 2 to the Sagittarius Arm.
The sight line to HD 92207 penetrates the Carina Arm at a Galactic longitude of ℓ ≈ 286°, so the Carina component RV2,LSR is blueshifted with respect to the local component RV1,LSR, and is probably formed to a large degree in the IC 2599 H II region. This hypothesis is supported by the good match of RV2,bc with the radial velocity of the H II region RVH II,bc = −6.3 ± 1 km s−1, obtained from hydrogen recombination lines (Caswell & Haynes 1987), and by the high RV value found for this sight line.
The sight line towards HD 111613 at ℓ ≈ 303° shows a strong second K I component, which is attributed to the Carina Arm. There is a third weaker component blueward of the two strong ones, which can be seen more clearly in the Na I D1 line (Fig. 7h), but it is ignored for the purpose of this study due to its weakness.
 |
Fig. 6 Images of the ISM bubble on the sight line towards HD 183143 in the WISE W3 (12 μm, left) and W4 (22 μm, right) bands. The orange lines give the extent of the major and minor axes of the bubble. |
 |
Fig. 7 Spectra of atomic ISM lines. Upper panels: observed spectra (black) of the interstellar K I line at λair = 7698.965 Å fitted with a two-Gaussian absorption model (red). Component numbers are indicated. The vertical dotted lines represent the laboratory wavelengths of the K I lines. The strong line at about λair = 9697.3 Å in panel d is a telluric O2 line. Lower panels: observed spectra (black) of the Na I D1 line at λair = 5895.924 Å (vertical dotted). For the cooler stars, HD 165784 and HD 111613, the interstellar Na I D1 lines are blended with a stellar component. The third Na I component at ~5895.3 Å in panel h is very weak compared to the other two and barely present in K I, such that it is neglected for the RV analysis as little DIB absorption can be expected to originate from it. The position of the K I and Na I line in the stellar rest frame is indicated by a vertical arrow. Wavelengths are in the LSR. |
Velocities and equivalent widths of the interstellar K I λ7698.965 Å absorption components.
5 DIB measurements
Our characterisation of the DIBs concentrates on three aspects. The first two are the identification of known and new DIBs, and the measurement of standard DIB properties: wavelength λ, EW, full width at half maximum FWHM, and central depth Ac (i.e. the classical data for DIB analyses). The third aspect is the extraction of the DIB profiles to perform DIB profile analyses, which is rarely done in the literature, unless the DIBs show substructure (see above).
The first step in the analysis of the CRIRES spectra is the identification of DIBs. We can build upon a collection of previously identified DIBs in the CRIRES wavelength range from the work of Joblin et al. (1990), Foing & Ehrenfreund (1994), Groh et al. (2007), Geballe et al. (2011), Cox et al. (2014), and Hamano et al. (2015). Detailed line profiles for these known DIBs are displayed in Fig. 8 for the standard star HD 183143. The telluric-corrected spectra and the original spectra with telluric lines (where a correction was performed) are both shown. These are the highest resolution data that have been presented so far, and the cleanest in terms of correction for telluric effects. However, the profiles still do not reflect the true DIB profiles as the sight line covers two absorption clouds (see the last section). The radial velocity difference of 14.6 km s−1 corresponds to a separation of the two absorption components by about 0.5 to 0.6 Å in the YJ band, leading to some asymmetries (assuming an intrinsically symmetric DIB profile). However, several broad features like DIB λ10438, 10697, 12623, and 13175 (Figs. 8e, f, l, and o) are clearly intrinsically asymmetric, with a steep blue drop and a slow redward rise. This band shape indicates an excitation of an electron, which changes the molecule's moment of inertia and results in the formation of a rotational branch head which leads to a short-wavelength spectral limit in the R branch (Sarre 2014). The detection of new DIBs is discussed in the next section.
We measured the DIBs' central vacuum wavelength at their absorption minima. If a DIB shows substructure with two minima, we chose the point of highest flux between the two minima as the band centre, assuming a P and R branch to be present. An example can be seen for HD 92207 in Fig. 11b, where the DIB centre is located at RV = 0 km s−1. In the case of newly detected DIBs, they are named after the approximate laboratory wavelength in air (see below).
Equivalent widths of the DIBs were measured with a semi-automated approach. First, we selected two continuum regions with central wavelengths λcont around a DIB. For each λcont a mean continuum flux was calculated from the interval [λcont - dλ, λcont + dλ] with an interval size of 8 or 20 bins. The continuum flux at the DIB position was then derived from a linear interpolation between the two continuum regions in order to avoid tampering with the DIB profile. Those intervals were also used to determine the S/N around the DIB. We did not fit predefined band profiles for EW measurements. Commonly used profiles, for example Gaussians, do not fit the band shapes well enough, which often show asymmetry or substructure. Instead, a direct integration of the line between the two continuum regions was performed. Cosmics and residuals of telluric lines were excluded by eye for the EW measurement. We calculated the errors σEW of the equivalent width, using the method of Vos et al. (2011),
 (1)
(1)
where Δλ is the wavelength range of the EW measurement and δλ is the spectral dispersion. If the telluric removal left noticeable residuals, we added an additional error on the order of the EWs of the telluric residuals. Finally, a third point was selected to mark the central band core with the maximum absorption Ac, which was selected by eye. Keeping both the continuum and the central depth fixed facilitated determining the FWHM automatically.
We used our RV measurements of the interstellar K I lines (Table 4) to estimate the DIB rest-frame wavelengths in air (λ0,air). The DIB EWs and K I EWs are known to correlate (Galazutdinov et al. 2004), which leads to the conclusion that the DIB RVs should relate closely to the RVs of the K I components. Every sight line shows two resolved K I components, but only one broadened DIB component, so that we chose the mean K I-RV as the estimated DIB-RV. We used an unweighted mean because the correlation between the DIB EWs and K I EWs is not very strong and should not be used to estimate DIB strengths. We calculated mean rest-frame wavelengths in air (Table A.1), using the International Astronomical Union (IAU) standard from Morton (1991) for the vacuum-to-air wavelength conversion. The statistical error was calculated from the standard deviation of the observed wavelengths from the sample stars. We estimate the systematic error of the rest-frame wavelength to 0.3 À, which corresponds approximately to half of the velocity difference between the two K I components.
All DIB identifications, both for known and for new DIBs, are summarised in Table A.1. The names of the DIBs are given as integers of approximate λ0,air, together with a reference to the detection publication. For every sight line and DIB measurement, central wavelengths in vacuum λνac in the barycentric rest frame are tabulated, along with the EW, Ac, and FWHM values.
There are literature values for eight DIBs in HD 183143 by Cox et al. (2014), based on X-Shooter observations on the ESO VLT, at R ≈ 10 000. Our EW values agree with their measurements, with the exceptions of the DIBs λλ10507, 10697, and 13175 shown in Figs. 8f, o and 9. We measure an EW for DIB 10507 of EW(10507) = 41 ± 10 mÅ, which is much smaller than the value of EWCox(10507) = 261 mÅ (no errors given). In Fig. 9 we see that a stellar N I line coincides with the DIB candidate 10507 from Cox et al. (2014). A much weaker DIB remains in HD 183143 after the correction for the stellar component (the O-star background stars of Cox et al. 2014, their Fig. 6, are unaffected by the N I blend), the quality of which can be assessed by comparison with the corrections of the other N I lines of the multiplet in this wavelength range. In HD 183143, the DIB wavelength shifts by 1 Å relative to HD 165784, so it is likely that there is still a blend with an unknown stellar line, but our value is certainly a refined upper limit for EW(10507). Our EW for DIB 10697, EW(10697) = 186 ± 7mÅ is considerably smaller than EWCox(10697) = 262 ± 36 mÅ because of a different continuum placement, compare our Fig. 8f with their Fig. 6, where their continuum was located at about the half peak height of the C I emission line. Our EW(13175) = 647 ± 20mÅ is larger than EWCox(13175) = 493 ± 36mÅ. This difference is probably caused by a different continuum placement and the asymmetric DIB profile which was fitted using a Gaussian by Cox et al. (2014), compare our Fig. 8o with their Fig. 4. If Gaussians were used for measurements, a twin Gaussian would be much better suited for this DIB. Our FWHM values of DIB λ13175 for HD 183143 and HD 165784 agree well with the literature values: Cox et al. (2014) measured FWHM(13175) = 4.5 ± 1.2 Å, Joblin et al. (1990) 4.0 ± 0.5 Å, and Smoker et al. (in prep.) a range from 3.6 ± 0.1 Å to 5.3 ± 0.1 Å. The EW of the  DIB λ9632, EW(9632) = 316 ± 99 mÅ agrees well with EWCox(9632) = 263 ± 3 mÅ. The narrow absorption in the DIB centre (Fig. 8a) must not be confused with the broad DIB (FWHM ≈ 2.5 Å) and is probably caused by noise.
 |
Fig. 8 Spectra of known DIBs in HD 183143 on the vacuum wavelength scale, in relative flux units. The central wavelength (see text) is indicated by a vertical dotted line. The spectrum before telluric correction is displayed as a grey dashed line in the cases where a correction was applied. Wavelengths are given in the barycentric rest frame. |
 |
Fig. 9 Diffuse interstellar bands λ10505 and 10507 in HD 183143 and HD 165784. The central DIB wavelengths are indicated by vertical dotted lines. The positions of stellar metal lines are also indicated. The spectrum corrected for N I absorption lines (the photospheric Fe II emission line is not reproduced by the model) is shown in black, the spectrum before the correction in dashed grey. |
6 New NIR DIBs
We identified a total of 12 new narrow DIBs in the NIR, almost doubling the number of known DIBs in the YJ band; about half of them were detected in the two sight lines with highest reddening. We compared their spectra to our unreddened reference star HD 87737 and to the synthetic spectra of the background stars to exclude a stellar origin for the DIB candidate lines. An overview of the new DIB line profiles in the DIB standard star HD 183143 is given in Fig. 10 and correlations of EW versus E(B–V) for the target stars are shown in Fig. B.1, which clearly emphasise the need for additional data. Each new DIB candidate is briefly discussed in the following.
λ10125.
This DIB is very weak in HD 183143. It is located between a stellar C I line at λvac = 10 126.635 Å and a stellar N I line at = 10 131.055Å. This DIB candidate should be investigated further on sight lines with even higher reddening.
λ10262.
This is also a very weak DIB. The E(B–V) – EW correlation suggests that the normalised EW of DIB λ10262 in HD 183143 is stronger than in HD 165784. This DIB is possibly more abundant per unit reddening in the circumstellar shell in front of HD 183143 (see Sect. 3.3).
λ10735, λ10884, λ11048.
These DIBs are weak to moderately strong in HD 183143. All are unaffected by telluric absorption.
λ11695.
This is a weak DIB, only detected in HD 165784 and HD 183143. The normalized EW is much stronger in HD 183143. Potentially, there are nearby Si I lines; the strongest is located at = 11 703.442 Å. There is a slightly stronger stellar Si I line from the same multiplet at λvac = 11 644.128 Å, which may be used to cross-check the significance of a possible blend with the DIB. However, in our background stars with Teff > 9000 K those lines are absent.
λ11699.
This weak DIB is located in a region with weak telluric contamination. It is detected on three sight lines and shows a tight E(B–V) – EW relation.
λ11721, λ11792.
Both DIB candidates are heavily blended with a telluric water vapour line. However, the simultaneous detection of DIB λ11721 in four sight lines and of DIB λ11792 in three sight lines, their good E(B–V) – EW-relations, and their absence in the spectrum of HD 87737 all indicate that the feature is not an artefact of the telluric correction.
λ11970.
This DIB is very strong and rather broad, but its EW can be substantially altered by a blend with a stellar He I line, increasingly for hotter stars (see Sect. 3.2). It is also blended with telluric lines, in particular in the red wing. Its identification as a DIB is indisputable because of its strong profile and Ac correlation with the previously reported DIBs λλ10780 and 11797.
 |
Fig. 10 Normalised spectra of new DIB candidates in HD 183143 on the vacuum wavelength scale. The central wavelength is indicated by a dotted vertical line. The spectrum before telluric correction is displayed as a grey dashed line in the cases where a correction was applied. Wavelengths are given in the barycentric rest frame. |
λ12222.
This weak DIB has several telluric lines in its vicinity and shows signs of a PR branch in HD 165784, which has to be confirmed in other sight lines, preferably in a hot ISM, such as H II regions. The available spectra of HD 92207 and HD 111613 do not cover this spectral region.
λ12838.
This DIB is detected in four sightlines. The E(B–V) – EW relation shows a linear trend. The red wing of the DIB is blended with a telluric line and has to be corrected carefully. We generally detect two single Gaussian band components for this DIB. This can be interpreted either as two separate DIBs or one broader DIB with a pronounced P and R branch. We consider a PR branch hypothesis more likely because the separation is most pronounced in our H II region sight line towards HD 92207. However, no definite conclusion can be drawn here because of the small sample size and low S/N.
7 DIB profile families
We define a DIB profile family as a set of DIBs that show very similar profiles and profile variations in all sight lines with detections of those DIBs. Traditionally, DIBs are considered to have a common carrier if they show a strong correlation of their EWs (e.g. Fan et al. 2022). But if those DIBs are also part of the same DIB profile family, they are more likely to have carriers with the same rotational constant and rotational temperature (Sarre 2014). This implies that their carriers also occur in the same region along the sight line, because they need the same environmental conditions and radial velocities to exhibit the same profile variation. We therefore consider DIB profile families a good tool for establishing structural relations between DIB carriers and to confirm EW-DIB families.
In this study the EW analysis is secondary to the profile analysis because of our small sample size. Consequently, if we want to verify whether two DIBs have the same or correlated carriers, and we have measurements of both DIBs in only up to four sight lines, EW correlation gives us little information about family membership because we only have up to four data points. Generally, the measurement of the equivalent width of a DIB can be subject to uncertainty because of a multitude of reasons: different (subjective) choice of the continuum, inaccurately treated stellar or telluric blends, cosmics or deficiencies of the detector. Additional profile analysis can show us the exact nature of these deviations in the spectrum. Most of those deviations give rise to narrower features than the DIBs themselves and they are easily distinguishable from DIBs (see e.g. Fig. 11b). Thus, a profile analysis is more robust against deviations than EW correlations.
Keeping this in mind, we compared all the DIB profiles from the present work, including already-known DIBs, in pairs for a given sight line, after normalising each DIB to a central depth of Ac =1. Good agreement was found for three DIBs. The starting point were the two strong DIBs λλ10780 and 11797, for which Hamano et al. (2015) found a very strong EW correlation with a correlation coefficient of r = 0.97(17) and an EW ratio of nearly 1:1. This DIB pair is detected in four sight lines (Fig. 11a). There is a clear uniform variation of the profiles: in HD 165784 the blue wing is steeper and the core is broader than in HD 183143 and HD 111613. In HD 92207 the DIB core seems to be broader than in all other sight lines. The matching profiles in all four sight lines leads us to confirm the assumption that this pair is in the same DIB family. The DIB λ11970 was added as a third member, where a pairwise comparison with the other two normalised DIBs is shown in the other panels of Fig. 11. Close agreement is also found in these cases, establishing the three DIBs as members of a profile family. We note that DIB λ11970 had to be corrected for the stellar He I component in some of the target stars (see Sect. 3.2) and for telluric absorption. For this DIB there are still some artefacts of a corrected telluric line at ~50 km s−1 visible in Figs. 11b, and c, in the form of weak emission in HD 111613 or as absorption in HD 92207.
During an EW correlation analysis the telluric artefacts cause a scatter in the otherwise linear EW correlation and weaken the relation between the DIBs λλ10780, 11797, and 11970 (see Fig. 12). Profile analysis circumvents this effect because the residuals due to blending lines can clearly be identified during profile comparison. For DIBs of the same profile family, Ac is a much better parameter to study the correlation of DIB strengths than EWs (Fig. 12).
The continuum-normalized profiles of the profile family λ10780-11797-11970 are displayed in Fig. 13 along with the K I line in velocity (and wavenumber) space for the sight line towards HD 183143 and to HD 92207. We can see that Ac decreases with increasing λ for HD 183143, as do the EWs. A similar behaviour is found for HD 165784 at 2/3 of the extinction of HD 183143. On the other hand, the ratios of EWs and Ac for the first two DIB profile family members are consistent with unity for the other two less reddened stars, while DIB λ11970 is a bit weaker. The comparison with the K I line in Fig. 13 allows the impact of the ISM cloud structure on the DIB structure to be estimated.
To conclude, this DIB profile set is highly interesting because of the matching profiles. If this can be confirmed with additional sight lines, it could be a good starting point for laboratory studies to find a matching DIB carrier.
 |
Fig. 11 Profile comparisons for the members of the DIB profile family λ10780-11797-11970. |
8 Summary and conclusions
We have introduced a combined ISM sight line and stellar analysis approach that involves a non-LTE analysis of high-resolution optical and near-IR spectra of the background stars. A subsequent comparison of the model and observed SED facilitates a thorough characterisation of the sight line reddening and reddening law, which is more robust than traditional approaches. Using telluric and stellar spectrum correction, 12 new DIB candidates were found in high spectral resolution observations of the YJ band with CRIRES, nearly doubling the known DIBs at these wavelengths. At the same time, this facilitated the characterisation of some known near-IR DIBs to be improved. Moreover, a first DIB profile family was established comprising the DIBs λ10780-11797-11970, which show remarkably similar profiles, suggesting that they emerge from the same carrier. Two of the DIBs had already been suggested to form a DIB family by Hamano et al. (2015). A match to the full SED of the DIB standard star HD 183143 including the unusual UV absorption bump was achieved for the first time, requiring an extra PAH component that we attribute to a circumstellar shell on the sight line towards HD 183143.
We have shown here the convincing potential of old CRIRES data for DIB studies in the near-IR. The extended simultaneous wavelength coverage of the upgraded CRIRES (Dorn et al. 2014) will allow systematic studies of the known and newly found near-IR DIBs to be performed in a much more time-efficient manner. New diagnostic links such as the DIB profile family established here plus recent improvements in laboratory techniques may steadily support the way to further DIB carrier identifications.
 |
Fig. 12 Plots of EW correlation (top row) and Ac correlation (bottom row) of the members of the DIB profile family λ10780–11797–11970. |
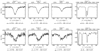 |
Fig. 13 Profile plots of the DIB family λ10780-11797-11970 and interstellar KI for the sight line of HD 183143 (top) and HD 92207 (bottom) in wavenumbers and radial velocity in the barycentric rest frame. |
Acknowledgements
We would like to thank the referee for useful comments that helped to improve the paper. A.E., D.W. and N.P. gratefully acknowledge support by the Austrian Science Fund FWF within the DK-ALM (W1259-N27). M.F. and N.P. acknowledge financial support by the Deutsche Forschungsgemeinschaft, DFG, project number PR 685/3-1. Based on observations collected at the European Southern Observatory under ESO programmes 62.H-0176, 079.D-0810(A) and 093.C-0380(A) and on observations collected at the Centro Astronomico Hispano Alemân at Calar Alto (CAHA), operated jointly by the Max-Planck Institut für Astronomie and the Instituto de Astrofisica de Andalucia (CSIC), proposal H2001-2.2-011. Travel of N.P. to the Calar Alto Observatory was supported by the DFG under grant PR 685/1-1. This research has made use of "Aladin sky atlas" developed at CDS, Strasbourg Observatory, France (Bonnarel et al. 2000). This publication makes use of data products from the Wide-field Infrared Survey Explorer, which is a joint project of the University of California, Los Angeles, and the Jet Propulsion Laboratory/California Institute of Technology, funded by the National Aeronautics and Space Administration. This publication makes use of data products from the Two Micron All Sky Survey, which is a joint project of the University of Massachusetts and the Infrared Processing and Analysis Center/California Institute of Technology, funded by the National Aeronautics and Space Administration and the National Science Foundation. This work has made use of data from the European Space Agency (ESA) mission Gaia (https://www.cosmos.esa.int/gaia), processed by the Gaia Data Processing and Analysis Consortium (DPAC, https://www.cosmos.esa.int/web/gaia/dpac/consortium). Funding for the DPAC has been provided by national institutions, in particular the institutions participating in the Gaia Multilateral Agreement.
Appendix A DIB measurements
Characterisation of the detected DIBs and new DIB candidates.
Appendix B E(B-V)-EW relations
 |
Fig. B.1 Correlations of the equivalent widths of the newly found NIR DIB candidates with E(B–V). Reddening values of the four DIB target stars are the following: E(B–V) = 0.39 (HD 111613), 0.48 (HD 92207), 0.86 (HD 165784), and 1.22 (HD 183143). |
References
- Baes, M., Verstappen, J., De Looze, I., et al. 2011, ApJS, 196, 22 [Google Scholar]
- Becker, S. R. 1998, ASP Conf. Ser., 131, 137 [NASA ADS] [Google Scholar]
- Bisht, D., Zhu, Q., Yadav, R. K. S., et al. 2021, MNRAS, 503, 5929 [NASA ADS] [CrossRef] [Google Scholar]
- Bonnarel, F., Fernique, P., Bienaymé, O., et al. 2000, A&AS, 143, 33 [NASA ADS] [CrossRef] [EDP Sciences] [Google Scholar]
- Bresolin, F., Kudritzki, R.-P., Mendez, R. H., & Przybilla, N. 2001, ApJ, 548, L159 [NASA ADS] [CrossRef] [Google Scholar]
- Butler, K., & Giddings, J. R. 1985, in Newsletter on Analysis of Astronomical Spectra (UK: University of London), 9 [Google Scholar]
- Cami, J., Sonnentrucker, P., Ehrenfreund, P., & Foing, B. H. 1997, A&A, 326, 822 [NASA ADS] [Google Scholar]
- Campbell, E. K., Holz, M., Gerlich, D., & Maier, J. P. 2015, Nature, 523, 322 [NASA ADS] [CrossRef] [Google Scholar]
- Camps, P., & Baes, M. 2015, Astron. Comput., 9, 20 [Google Scholar]
- Cardelli, J. A., Clayton, G. C., & Mathis, J. S. 1989, ApJ, 345, 245 [Google Scholar]
- Caswell, J. L., & Haynes, R. F. 1987, A&A, 171, 261 [NASA ADS] [Google Scholar]
- Clough, S. A., Kneizys, F. X., Rothman, L. S., & Gallery, W. O. 1981, Proc. SPIE, 277, 152 [NASA ADS] [CrossRef] [Google Scholar]
- Clough, S. A., Iacono, M. J., & Moncet, J.-L. 1992, J. Geophys. Res., 97, 15761 [NASA ADS] [CrossRef] [Google Scholar]
- Cordiner, M. A., Cox, N. L. J., Trundle, C., et al. 2008a, A&A, 480, L13 [NASA ADS] [CrossRef] [EDP Sciences] [Google Scholar]
- Cordiner, M. A., Smith, K. T., Cox, N. L. J., et al. 2008b, A&A, 492, L5 [NASA ADS] [CrossRef] [EDP Sciences] [Google Scholar]
- Cordiner, M. A., Linnartz, H., Cox, N. L. J., et al. 2019, ApJ, 875, L28 [NASA ADS] [CrossRef] [Google Scholar]
- Cox, N. L. J., Cami, J., Kaper, L., et al. 2014, A&A, 569, A117 [NASA ADS] [CrossRef] [EDP Sciences] [Google Scholar]
- Cox, N. L. J., Cami, J., Farhang, A., et al. 2017, A&A, 606, A76 [NASA ADS] [CrossRef] [EDP Sciences] [Google Scholar]
- Cutri, R. M., Skrutskie, M. F., van Dyk, S., et al. 2003, VizieR Online Data Catalog: II/246 [Google Scholar]
- Cutri, R. M., et al. 2012, VizieR Online Data Catalog: II/311 [Google Scholar]
- Dorn, R. J., Anglada-Escude, G., Baade, D., et al. 2014, The Messenger, 156, 7 [NASA ADS] [Google Scholar]
- Ehrenfreund, P., Cami, J., Jiménez-Vicente, J., et al. 2002, ApJ, 576, L117 [NASA ADS] [CrossRef] [Google Scholar]
- Elyajouri, M., & Lallement, R. 2019, A&A, 628, A67 [NASA ADS] [CrossRef] [EDP Sciences] [Google Scholar]
- Elyajouri, M., Lallement, R., Cox, N. L. J., et al. 2018, A&A, 616, A143 [NASA ADS] [CrossRef] [EDP Sciences] [Google Scholar]
- Fan, H., Hobbs, L. M., Dahlstrom, J. A., et al. 2019, ApJ, 878, 151 [NASA ADS] [CrossRef] [Google Scholar]
- Fan, H., Schwartz, M., Farhang, A., et al. 2022, MNRAS, 510, 3546 [NASA ADS] [CrossRef] [Google Scholar]
- Firnstein, M., & Przybilla, N. 2012, A&A, 543, A80 [NASA ADS] [CrossRef] [EDP Sciences] [Google Scholar]
- Fitzpatrick, E. L., & Massa, D. 2005, AJ, 130, 1127 [NASA ADS] [CrossRef] [Google Scholar]
- Foing, B. H., & Ehrenfreund, P. 1994, Nature, 369, 296 [NASA ADS] [CrossRef] [Google Scholar]
- Gaia Collaboration (Prusti, T., et al.) 2016, A&A, 595, A1 [NASA ADS] [CrossRef] [EDP Sciences] [Google Scholar]
- Gaia Collaboration (Brown, A.G.A., et al.) 2021, A&A, 649, A1 [NASA ADS] [CrossRef] [EDP Sciences] [Google Scholar]
- Galazutdinov, G. A., Manicò, G., Pirronello, V., & Krełowski, J. 2004, MNRAS, 355, 169 [NASA ADS] [CrossRef] [Google Scholar]
- Galazutdinov, G. A., Lee, J.-J., Han, I., et al. 2017, MNRAS, 467, 3099 [NASA ADS] [CrossRef] [Google Scholar]
- Geballe, T. R., Najarro, F., Figer, D. F., Schlegelmilch, B. W., & de La Fuente, D. 2011, Nature, 479, 200 [Google Scholar]
- Giddings, J. R. 1981, PhD thesis, University of London, UK [Google Scholar]
- González, J. F., Hubrig, S., Przybilla, N., et al. 2017, MNRAS, 467, 437 [Google Scholar]
- González, J. F., Briquet, M., Przybilla, N., et al. 2019, A&A, 626, A94 [NASA ADS] [CrossRef] [EDP Sciences] [Google Scholar]
- Groh, J. H., Damineli, A., & Jablonski, F. 2007, A&A, 465, 993 [NASA ADS] [CrossRef] [EDP Sciences] [Google Scholar]
- Hamano, S., Kobayashi, N., Kondo, S., et al. 2015, ApJ, 800, 137 [NASA ADS] [CrossRef] [Google Scholar]
- Heckman, T.M., & Lehnert, M.D. 2000, ApJ, 537, 690 [NASA ADS] [CrossRef] [Google Scholar]
- Heger, M. L. 1922, Lick Observ. Bull., 10, 141 [NASA ADS] [CrossRef] [Google Scholar]
- Helou, G., & Walker, D. W., 1988, Infrared Astronomical Satellite (IRAS) Catalogs and Atlases, The Small Scale Structure Catalog, 7 [Google Scholar]
- Henyey, L. G., & Greenstein, J. L. 1941, ApJ, 93, 70 [Google Scholar]
- Herbig, G. H. 1995, ARA&A, 33, 19 [Google Scholar]
- Hobbs, L. M., York, D. G., Thorburn, J. A., et al. 2009, ApJ, 705, 32 [Google Scholar]
- Hou, L. G., & Han, J. L. 2014, A&A, 569, A125 [NASA ADS] [CrossRef] [EDP Sciences] [Google Scholar]
- Joblin, C., Maillard, J. P., D'Hendecourt, L., & Léger, A. 1990, Nature, 346, 729 [NASA ADS] [CrossRef] [Google Scholar]
- Jung, Y. 2014, CRIRES Pipeline User Manual, VLT-MAN-ESO-019500-4406 (ESO) [Google Scholar]
- Junkkarinen, V. T., Cohen, R. D., Beaver, E. A., et al. 2004, ApJ, 614, 658 [NASA ADS] [CrossRef] [Google Scholar]
- Kaufer, A., Stahl, O., Wolf, B., et al. 1996, A&A, 305, 887 [NASA ADS] [Google Scholar]
- Kaufer, A., Stahl, O., Tubbesing, S., et al. 1999, The Messenger, 95, 8 [Google Scholar]
- Käufl, Ballester, P., Biereichel, P., et al. 2004, Proc. SPIE, 5492, 1218 [CrossRef] [Google Scholar]
- Kausch, W., Noll, S., Smette, A., et al. 2015, A&A, 576, A78 [NASA ADS] [CrossRef] [EDP Sciences] [Google Scholar]
- Kimeswenger, S., Rainer, M., Przybilla, N., & Kausch, W. 2021, AJ, 161, 66 [NASA ADS] [CrossRef] [Google Scholar]
- Kramida, A., Yu. Ralchenko, Reader, J., & NIST ASD Team 2019, NIST Atomic Spectra Database (ver. 5.7.1), Available: https://physics.nist.gov/asd, National Institute of Standards and Technology, Gaithersburg, MD [Google Scholar]
- Krelowski, J., & Walker, G. A. H. 1987, ApJ, 312, 860 [NASA ADS] [CrossRef] [Google Scholar]
- Kudritzki, R. P., Urbaneja, M. A., Bresolin, F., & Przybilla, N. 2008, Phys. Scr. T, 133, 014039 [NASA ADS] [CrossRef] [Google Scholar]
- Kudritzki, R.-P., Urbaneja, M. A., Gazak, Z., et al. 2013, ApJ, 779, L20 [NASA ADS] [CrossRef] [Google Scholar]
- Kudritzki, R.-P., Urbaneja, M. A., Bresolin, F., et al. 2014, ApJ, 788, 56 [NASA ADS] [CrossRef] [Google Scholar]
- Kurucz, R. 1993, CD-ROM No. 13 (Cambridge, Mass: SAO) [Google Scholar]
- Lallement, R., Cox, N. L. J., Cami, J., et al. 2018, A&A, 614, A28 [NASA ADS] [CrossRef] [EDP Sciences] [Google Scholar]
- Li, A., & Draine, B. T. 2001, ApJ, 554, 778 [Google Scholar]
- Massa, D., Savage, B. D., & Fitzpatrick, E. L. 1983, ApJ, 266, 662 [NASA ADS] [CrossRef] [Google Scholar]
- Maza, N. L., Nieva, M.-F., & Przybilla, N. 2014, A&A, 572, A112 [NASA ADS] [CrossRef] [EDP Sciences] [Google Scholar]
- McCall, B. J., Drosback, M. M., Thorburn, J. A., et al. 2010, ApJ, 708, 1628 [NASA ADS] [CrossRef] [Google Scholar]
- Mermilliod, J. C. 1997, VizieR Online Data Catalog: II/168 [Google Scholar]
- Morton, D. C. 1991, ApJS, 77, 119 [Google Scholar]
- Nieva, M. F., & Przybilla, N. 2007, A&A, 467, 295 [NASA ADS] [CrossRef] [EDP Sciences] [Google Scholar]
- Nieva, M. F., & Przybilla, N. 2012, A&A, 539, A143 [NASA ADS] [CrossRef] [EDP Sciences] [Google Scholar]
- Nieva, M.-F., & Przybilla, N. 2014, A&A, 566, A7 [NASA ADS] [CrossRef] [EDP Sciences] [Google Scholar]
- Omont, A. 2016, A&A, 590, A52 [NASA ADS] [CrossRef] [EDP Sciences] [Google Scholar]
- Omont, A., Bettinger, H. F., & Tönshoff, C. 2019, A&A, 625, A41 [NASA ADS] [CrossRef] [EDP Sciences] [Google Scholar]
- Pfeiffer, M. J., Frank, C., Baumueller, D., Fuhrmann, K., & Gehren, T. 1998, A&AS, 130, 381 [NASA ADS] [CrossRef] [EDP Sciences] [Google Scholar]
- Przybilla, N. 2005, A&A, 443, 293 [NASA ADS] [CrossRef] [EDP Sciences] [Google Scholar]
- Przybilla, N., & Butler, K. 2001, A&A, 379, 955 [NASA ADS] [CrossRef] [EDP Sciences] [Google Scholar]
- Przybilla, N., & Butler, K. 2004, ApJ, 609, 1181 [NASA ADS] [CrossRef] [Google Scholar]
- Przybilla, N., Butler, K., Becker, S. R., Kudritzki, R. P., & Venn, K. A. 2000, A&A, 359, 1085 [NASA ADS] [Google Scholar]
- Przybilla, N., Butler, K., Becker, S. R., & Kudritzki, R. P. 2001a, A&A, 369, 1009 [CrossRef] [EDP Sciences] [Google Scholar]
- Przybilla, N., Butler, K., & Kudritzki, R. P. 2001b, A&A, 379, 936 [NASA ADS] [CrossRef] [EDP Sciences] [Google Scholar]
- Przybilla, N., Butler, K., Becker, S. R., & Kudritzki, R. P. 2006, A&A, 445, 1099 [NASA ADS] [CrossRef] [EDP Sciences] [Google Scholar]
- Przybilla, N., Nieva, M. F., Tillich, A., et al. 2008, A&A, 488, L51 [NASA ADS] [CrossRef] [EDP Sciences] [Google Scholar]
- Przybilla, N., Fossati, L., Hubrig, S., et al. 2016, A&A, 587, A7 [NASA ADS] [CrossRef] [EDP Sciences] [Google Scholar]
- Przybilla, N., Fossati, L., & Jeffery, C. S. 2021, A&A, 654, A119 [NASA ADS] [CrossRef] [EDP Sciences] [Google Scholar]
- Ramírez-Tannus, M. C., Cox, N. L. J., Kaper, L., & de Koter, A. 2018, A&A, 620, A52 [NASA ADS] [CrossRef] [EDP Sciences] [Google Scholar]
- Rothman, L. S., Jacquemart, D., Barbe, A., et al. 2005, J. Quant. Spectr. Rad. Transf., 96, 139 [NASA ADS] [CrossRef] [Google Scholar]
- Sarre, P. J. 2014, in The Diffuse Interstellar Bands, eds. J. Cami, & N. L. J. Cox (Berlin: Springer), 297, 34 [NASA ADS] [Google Scholar]
- Sarre, P. J., Miles, J. R., Kerr, T. H., et al. 1995, MNRAS, 277, L41 [NASA ADS] [Google Scholar]
- Schiller, F., & Przybilla, N. 2008, A&A, 479, 849 [NASA ADS] [CrossRef] [EDP Sciences] [Google Scholar]
- Schönrich, R., Binney, J., & Dehnen, W. 2010, MNRAS, 403, 1829 [CrossRef] [Google Scholar]
- Seifahrt, A., Käufl, H. U., Zängl, G., et al. 2010, A&A, 524, A11 [NASA ADS] [CrossRef] [EDP Sciences] [Google Scholar]
- Siebenmorgen, R., Voshchinnikov, N. V., & Bagnulo, S. 2014, A&A, 561, A82 [NASA ADS] [CrossRef] [EDP Sciences] [Google Scholar]
- Skrutskie, M. F., Cutri, R. M., Stiening, R., et al. 2006, AJ, 131, 1163 [NASA ADS] [CrossRef] [Google Scholar]
- Smette, A., Sana, H., Noll, S., et al. 2015, A&A, 576, A77 [NASA ADS] [CrossRef] [EDP Sciences] [Google Scholar]
- Snow, T. P. 2014, in The Diffuse Interstellar Bands, eds. J. Cami, & N. L. J. Cox (Berlin: Springer), 297, 3 [NASA ADS] [Google Scholar]
- Spieler, S., Kuhn, M., Postler, J., et al. 2017, ApJ, 846, 168 [NASA ADS] [CrossRef] [Google Scholar]
- Tielens, A. G. G. M. 2014, in The Diffuse Interstellar Bands, eds. J. Cami, & N. L. J. Cox (Berlin: Springer), 297, 399 [NASA ADS] [Google Scholar]
- Vos, D. A. I., Cox, N. L. J., Kaper, L., Spaans, M., & Ehrenfreund, P. 2011, A&A, 533, A129 [NASA ADS] [CrossRef] [EDP Sciences] [Google Scholar]
- Wesselius, P. R., van Duinen, R. J., de Jonge, A. R. W., et al. 1982, A&AS, 49, 427 [NASA ADS] [Google Scholar]
- Zubko, V., Dwek, E., & Arendt, R. G. 2004, ApJS, 152, 211 [NASA ADS] [CrossRef] [Google Scholar]
The component of the K I resonance doublet at λair = 7664.899 Å is often contaminated by the telluric A band of O2 (e.g. Kimeswenger et al. 2021).
All Tables
Velocities and equivalent widths of the interstellar K I λ7698.965 Å absorption components.
All Figures
|
Fig. 1 WISE imaging (1° × 1°) of the ISM in the sight lines towards the target stars, from left to right: HD 183143, HD 165784, HD 92207 and HD 111613. Colour code: Red (W4, 22 μm), green (W2, 4.6 μm), blue (W1, 3.4 μm). The target stars are centred and indicated by a cross. |
| In the text | |
|
Fig. 2 Importance of non-LTE effects. Left panel: comparison of synthetic line profiles for the Mg II λ9632 Å blend to DIB λ9632Å in HD 165784, for the average magnesium abundance derived for the star: non-LTE (solid line), LTE (dashed line), LTE profile for an adjusted abundance that allows the non-LTE EW to be reproduced (dotted line: identical to the solid line in this case). The profiles were convolved with the appropriate broadening functions for the star. Right panel: same as in the left panel, but for He I λ11970 Å blend to DIB λ 11970 Å, for HD 183143 (see text for discussion). |
| In the text | |
|
Fig. 3 Correction of the band profile of DIB λ9632 in HD 165784 and DIB λ11970 in HD 183143. Displayed are the observed spectrum (dashed black line); the synthetic spectrum (blue line) of the Mg II line of the background star HD 165784; the He I line of the background star HD 183143 and the corrected spectrum, i.e. the observed spectrum divided by the stellar spectrum, showing the DIB (red line). Wavelengths and wavenumbers are given in the barycentric rest frame. |
| In the text | |
|
Fig. 4 Measurements of three sample star SEDs, compiled from IUE data (black curve) and photometric data (boxes). The CCM extinction law was employed to redden the synthetic ATLAS9 SEDs of the background stars (red); see text for discussion. |
| In the text | |
|
Fig. 5 Comparison of the measured (black) and model SEDs for HD 183143. Two model solutions are shown: Application of the CCM extinction law to the ATLAS9 SED with E(B–V) = 1.02 and RV = 3.8 (dashed blue line) and a modification by employing SKIRT to introduce additional extinction by a PAH component, including secondary emission (red line). With the additional PAH component extinction, values of E(B–V) = 1.22 and RV = 3.3 are required to obtain a near-perfect fit to the observed SED. |
| In the text | |
|
Fig. 6 Images of the ISM bubble on the sight line towards HD 183143 in the WISE W3 (12 μm, left) and W4 (22 μm, right) bands. The orange lines give the extent of the major and minor axes of the bubble. |
| In the text | |
|
Fig. 7 Spectra of atomic ISM lines. Upper panels: observed spectra (black) of the interstellar K I line at λair = 7698.965 Å fitted with a two-Gaussian absorption model (red). Component numbers are indicated. The vertical dotted lines represent the laboratory wavelengths of the K I lines. The strong line at about λair = 9697.3 Å in panel d is a telluric O2 line. Lower panels: observed spectra (black) of the Na I D1 line at λair = 5895.924 Å (vertical dotted). For the cooler stars, HD 165784 and HD 111613, the interstellar Na I D1 lines are blended with a stellar component. The third Na I component at ~5895.3 Å in panel h is very weak compared to the other two and barely present in K I, such that it is neglected for the RV analysis as little DIB absorption can be expected to originate from it. The position of the K I and Na I line in the stellar rest frame is indicated by a vertical arrow. Wavelengths are in the LSR. |
| In the text | |
|
Fig. 8 Spectra of known DIBs in HD 183143 on the vacuum wavelength scale, in relative flux units. The central wavelength (see text) is indicated by a vertical dotted line. The spectrum before telluric correction is displayed as a grey dashed line in the cases where a correction was applied. Wavelengths are given in the barycentric rest frame. |
| In the text | |
|
Fig. 9 Diffuse interstellar bands λ10505 and 10507 in HD 183143 and HD 165784. The central DIB wavelengths are indicated by vertical dotted lines. The positions of stellar metal lines are also indicated. The spectrum corrected for N I absorption lines (the photospheric Fe II emission line is not reproduced by the model) is shown in black, the spectrum before the correction in dashed grey. |
| In the text | |
|
Fig. 10 Normalised spectra of new DIB candidates in HD 183143 on the vacuum wavelength scale. The central wavelength is indicated by a dotted vertical line. The spectrum before telluric correction is displayed as a grey dashed line in the cases where a correction was applied. Wavelengths are given in the barycentric rest frame. |
| In the text | |
|
Fig. 11 Profile comparisons for the members of the DIB profile family λ10780-11797-11970. |
| In the text | |
|
Fig. 12 Plots of EW correlation (top row) and Ac correlation (bottom row) of the members of the DIB profile family λ10780–11797–11970. |
| In the text | |
|
Fig. 13 Profile plots of the DIB family λ10780-11797-11970 and interstellar KI for the sight line of HD 183143 (top) and HD 92207 (bottom) in wavenumbers and radial velocity in the barycentric rest frame. |
| In the text | |
|
Fig. B.1 Correlations of the equivalent widths of the newly found NIR DIB candidates with E(B–V). Reddening values of the four DIB target stars are the following: E(B–V) = 0.39 (HD 111613), 0.48 (HD 92207), 0.86 (HD 165784), and 1.22 (HD 183143). |
| In the text | |
Current usage metrics show cumulative count of Article Views (full-text article views including HTML views, PDF and ePub downloads, according to the available data) and Abstracts Views on Vision4Press platform.
Data correspond to usage on the plateform after 2015. The current usage metrics is available 48-96 hours after online publication and is updated daily on week days.
Initial download of the metrics may take a while.