| Issue |
A&A
Volume 693, January 2025
|
|
|---|---|---|
| Article Number | A115 | |
| Number of page(s) | 12 | |
| Section | Astronomical instrumentation | |
| DOI | https://doi.org/10.1051/0004-6361/202451632 | |
| Published online | 08 January 2025 | |
Using Gaia and synthetic photometry for the absolute flux calibration of planetary cameras: The case of BepiColombo/SIMBIO-SYS
1
INAF Astronomical Observatory of Padova,
Vicolo dell’Osservatorio 5,
35122
Padova,
Italy
2
INAF Osservatorio di Astrofisica e Scienza dello Spazio,
via Gobetti 93/3,
40129
Bologna,
Italy
3
Dipartimento di Fisica e Astronomia “Augusto Righi”, Alma Mater Studiorum, Università di Bologna,
via Gobetti 93/2,
40129
Bologna,
Italy
★ Corresponding author; [email protected]
Received:
23
July
2024
Accepted:
10
November
2024
Context. The absolute flux calibration of a planetary camera is pivotal for a quantitative analysis of the brightness that is reflected by a celestial body to a) characterise its microphysical properties, b) analyse changes caused by exogenic or endogenic activity, and c) produce high-quality image mosaics to understand the geology of the body. This is usually done by observing a few standard stars. We propose an alternative method that relies on the Gaia catalogue and consider the Spectrometer and Imagers for Mpo Bepicolombo Integrated Observatory SYStem (SIMBIO-SYS) suite of imagers on board BepiColombo, which is currently flying towards planet Mercury, as a test case. We discuss the advantages of this method and its implications for the future exploration of Mercury, as well as the applicability to other cameras.
Aims. We evaluate whether Gaia low-resolution spectra (XPSP) are suitable to supply a set of reference stars for an absolute calibration of a planetary camera. We assess the performances of this approach and discuss its advantages with respect to more traditional methods. While this was validated for common astronomical facilities, it has never been used for planetary cameras.
Methods. We used synthetic photometry from Gaia low-resolution (BP/RP) spectra to produce magnitudes in all the passbands of SIMBIO-SYS. We used a set of very reliable spectrophotometric standard stars to correct small residual systematics that affect externally calibrated BP/RP spectra, and we thus defined the SIMBIO-SYS photometric system tied to the flux scale of the CALSPEC spectrophotometric library. We evaluated the uncertainties on the final calibration of this photometric system by assessing the accuracy (average of the residuals) and precision (standard deviation of the residuals) of the reproduced magnitudes of stars in the CALSPEC spectrophotometric library.
Results. We find an accuracy better than 0.1% and a precision ranging from 0.4% to 1.0%, depending on the considered passband, in the magnitude and colour ranges that are relevant for stars that can be used as photometric standards for the SIMBIO-SYS instrument.
Conclusions. Our results imply an improvement in the flux uncertainty through the absolute calibration of a factor 2–12 with respect to pre-existing imaging data of Mercury, and of a factor 2–7 with respect to the Colour and Stereo Surface Imaging System (CaSSIS), which is a similar camera with the same detector that orbits Mars, for which the absolute calibration details are available in the literature. In the context of the future exploration of Mercury, these improvements imply an unprecedented sensitivity of the SIMBIO-SYS instrument that will provide a novel view of the present-day surface activity on Mercury and of the photometric properties of the Hermean surface.
Key words: instrumentation: miscellaneous / astronomical databases: miscellaneous / catalogs / planets and satellites: surfaces
© The Authors 2025
 Open Access article, published by EDP Sciences, under the terms of the Creative Commons Attribution License (https://creativecommons.org/licenses/by/4.0), which permits unrestricted use, distribution, and reproduction in any medium, provided the original work is properly cited.
This article is published in open access under the Subscribe to Open model. Subscribe to A&A to support open access publication.
1 Introduction
An absolute flux calibration is pivotal for a full scientific exploitation of data acquired with planetary remote-sensing cameras. When the data have a good absolute flux-calibrated imaging and are multispectral, high-quality, seamless global and regional monochrome or colour mosaics can be produced. These are key for the geologic analysis of any planetary surface. An accurate absolute flux calibration is also fundamental for a quantitative analysis of the surface brightness variations associated with potential surface changes (i.e. new volcanic eruptions, volatile degassing, or fresh craters) and space-weathering effects. It is also required for a quantitative spectrophotometric comparison with laboratory experiments. This procedure consists of converting raw data or digital numbers (DN) into absolute physical units (W m−2 sr−1 nm−1 or I/F; i.e. the ratio of the observed radiance and the radiance of a 100% Lambertian reflector with the Sun and camera orthogonal to the observing surface). In planetary missions, this is typically accomplished by observing sources for which accurate measurements of their spectral irradiance on the ground (integrating spheres with known irradiance) and in flight are available, that is, spectrophotometric standards or standards. However, planetary cameras are telescopes with typically small diameters, which implies that only very bright calibration sources have a sufficient signal-to-noise ratio when they are observed at integration times similar to those used for imaging the relatively brighter planetary surfaces. For example, Thomas et al. (2022) observed four ESO spectrophotometric standards, all of which had a visual magnitude brighter than 5.0. The ESO spectrophotometric standards list reports just 11 objects that satisfy this requirement. In addition to stars, planets (i.e. Jupiter) and some of their satellites (i.e. the Moon or Phobos) are also used due to their closer proximity and consequently higher irradiance. However, their spectra are not as precise as spectrophotometric standards, which limits the accuracy of the calibration to 5–7% for the Moon, for example (Tan et al. 2022). As a consequence, the two approaches offer a limited inventory of calibrators that result in a poor characterisation of small (but not negligible) calibration uncertainties that depend on the absolute flux (i.e. magnitude) or spectral slope (i.e. colours). It is therefore beneficial to find a wider sample of standards to improve the absolute flux calibration of planetary cameras.
Since 2014, the European Space Agency (ESA) Gaia space mission (Gaia Collaboration 2016) is collecting exquisite astrometry and photometry for about two billion stars brighter than G ≃ 20.5 mag (see Brown 2021, for a summary of the data products and highlights on the impressive harvest of scientific results). The low-resolution spectra obtained with the BP and RP spectrophotometers (referred to as XP spectra from now on) have been released for the first time for roughly 220 million sources with Gaia G magnitude G < 17.65 mag in the most recent (third) data release (Gaia DR3, Gaia Collaboration et al. 2023b; De Angeli et al. 2023). Gaia Collaboration (2023a) demonstrated that remarkably accurate and very precise synthetic photometry can be obtained from flux-calibrated XP spectra for virtually any passband whose wavelength range is entirely enclosed within the XP spectral range, that is, 330 nm≤ λ ≤ 1050 nm (Montegriffo et al. 2023). This means that precise space-based all-sky photometry can be obtained for a huge number of stars for the first time and that the photometric systems of other surveys in the optical range can be calibrated, regardless of whether the surveys operate from space or from the ground. Synthetic photometry from XP spectra (XPSP hereafter) has been used for calibration and validation of various photometric surveys (see, e.g., Martin et al. 2024; Xiao et al. 2023a,b, 2024; Thomas et al. 2023) and is becoming a fundamental photometric reference in the optical domain.
In this paper, we assess whether Gaia XPSP can be used for the absolute flux calibration on a planetary remote-sensing camera by taking the Spectrometer and Imaging for MPO BepiColombo Integrated Observatory SYStem (SIMBIO-SYS; Cremonese et al. 2020) instrument on the ESA-Japanese Aerospace Exploration Agency (JAXA) BepiColombo mission as a test case. While this approach has been tested and validated for common astronomical facilities (i.e. the James Webb Space Telescope, the Hubble Space Telescope, or the Sloan Digital Sky Survey), it has never been used in the context of a multifilter planetary camera. Unlike general-purpose astronomical facilities, the latter represents a significantly different case because of the peculiar passbands, which are optimised to highlight the specific mineralogy of the planetary body and can differ from commonly used astronomical filter systems. We first briefly review the specifics of the instrument and briefly describe the expected enhanced scientific output that the improved absolute flux calibrations will bring. We then briefly describe the Gaia catalogue and its application in the synthetic photometry method developed by Gaia Collaboration (2023a). We finally present the typical accuracy and precision that can be achieved with this approach. We discuss our results in the context of the SIMBIO-SYS instrument and their applicability for other planetary remote-sensing instruments.
 |
Fig. 1 HRIC transmission profiles accounting for optics, filters, and detector QE wavelength-dependent response curves from Zusi et al. (2019). |
2 The SIMBIO-SYS instrument
SIMBIO-SYS is a suite of three instruments that is included in the payload of the Mercury Planetary Orbiter (MPO) of the BepiColombo mission. It is designed for the imaging and spectroscopic investigation of the Hermean surface (the surface of Mercury) from 0.4 to 2.0 µm. It will examine the surface topography, morphology, and composition, with the goals of understanding the Herman surface geology, its volcanic and tectonic history, its age, and the surface volatile distributions, and it will perform geophysical measurements (i.e. libration; Rothery et al. 2020; Cremonese et al. 2020). A detailed description of the instrument and its scientific objectives was given by Cremonese et al. (2020), while an overview of its scientific rationale at mission level was given by Rothery et al. (2020). We still provide some basic context information here. SIMBIO-SYS consists of three channels: the STereo imaging Channel (STC), with a broad spectral band in the 600-800 nm range, a field of view (FOV) of 2.31° × 5.38°, and four narrow-band filters (centred at 420.6, 550.0, 749.6, and 923.8 nm) with a field of 0.38° × 5.38° at a medium spatial resolution (60 m/px at 480 km from the surface). This will provide a digital terrain model of the entire planet surface with an accuracy better than 80 m. The High Resolution Imaging Channel (HRIC) has a broad spectral band in the 400–900 nm range, three narrow-band filters (centred at 549.3 nm, 752.9 nm, and 880.1 nm), and a high spatial resolution (6 m/px at 480 km from the surface). This will provide high-resolution images of about 10% of the surface in the one-year nominal mission. The STC and HRIC wavelength-dependent instrument transmission functions including the optics reflectivity, filter transmission, and detector quantum efficiencies are provided in Figs. 1 and 2, respectively. The on-ground radio-metric calibration of the instrument was described in detail by Cremonese et al. (2020) and references therein. In particular, the current on-ground radiometric calibration of the two cameras includes a detailed characterisation (see e.g. Cremonese et al. 2020) of the dark current (DC) behaviour; the detector read-out noise (RON); the fixed-pattern noise (FPN), that is, the spatial noise; the photo response (PR), and photo response non-uniformity (PRNU) versus radiation flux, integration time, and wavelength. Finally, absolute calibration is achieved by acquiring images of an illuminating sphere of known spectral irradiances.
The uncertainties in these pre-launch calibrations range from 3–5% for HRIC and 21–28% for STC. These performance will be verified and improved with the in-flight calibration when the instrument reaches orbit around Mercury. Finally, the Visible and near-Infrared Hyperspectral Imaging channel (VIHI) has a high spectral resolution (6 nm at its finest) in the 400–2000 nm range and a spatial resolution up to 120 m/px at 480 km from the surface. This instrument will provide global hyper-spectral coverage at 480 m/px assuming a 480 km orbit. The presence of two imaging channels prompted us to optimise their radiometric and geometrical calibration so that highly accurate measurements of the surface can be performed that are critical to several scientific questions about Mercury. While the scope of this paper is not to discuss these scientific rationales, we outline some key points for which a well-calibrated instrument is crucial. Accurate absolute photometric measurements will be required to assess whether the surface activity on Mercury is ongoing, as suggested by hollows and the fresh surface features that appeared during the MESSENGER mission (Speyerer et al. 2022). By analysing STC and HRIC photometry of these feature, it will be possible to characterise surface changes over more than a decade since they were last observed by MESSENGER. Data that are photometrically well calibrated are also fundamental for the production of high-quality global and regional colour and monochrome mosaics, which are one of the main scientific objectives of the instrument (Cremonese et al. 2020). The systematic errors in the absolute flux will render the photometric standardisation and correction of images challenging and will limit the scientific output of these products. Finally, highly accurate absolute fluxes will be pivotal for the future characterisation of the photometric properties of the Mercury surface, which are tied to its composition and microphysical structure such as texture, grain size, shape, and porosity (Hapke 2012; Souchon et al. 2011; Munaretto et al. 2023). In particular, STC and HRIC will obtain novel observations of the surface at phase angles near zero. In this phase range, the brightness of a given surface increases significantly due to the opposition surge, which is dominated by the coherent back-scattering and shadow-hiding effects (Hapke 2012). On the other hand, MESSENGER images were acquired at phase angles higher than 30°, where these effects are completely absent. The SIMBIO-SYS data, combined with spectrophotometric modelling approaches, will therefore provide a new view of the photometric and microphysical properties of the Mercury surface. For this to be done, however, accurate flux-calibrated data are required. In summary, it will be pivotal to minimise the uncertainties (i.e. accuracy and precision) of the absolute flux calibration of STC and HRIC to maximise the scientific output of the SIMBIO-SYS instrument.
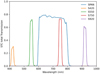 |
Fig. 2 Same as Fig. 1, but for STC from Deppo et al. (2016) |
3 Synthethic photometry
Gaia Collaboration (2023a) illustrated the general principles of synthetic photometry and described in detail how this can be obtained from Gaia XP spectra. We brief recapitulate this for convenience.
Synthetic photometry is the basic tool that is needed to tie a given magnitude scale to a physical flux scale. In principle, one single star with a reliable flux-calibrated spectrum, the spectral energy distribution (SED), can be used for this purpose (this is in fact the case, e.g., for the Sloand Digital Sky Survey (SDSS) system Fukugita et al. 1996). A photometric observation is made by integrating the flux from a source over a wavelength interval defined by a filter function (transmission curve). Following Bessell & Murphy (2012), we denote with fν a monochromatic flux per frequency unit, and with fλ the monochromatic flux per wavelength unit, so that fλ (λ) represents the source SED. When S (λ) is the transmission curve of a passband of a given photometric system that includes all the factors that define its shape as a function of wavelength1, then the mean energy flux measured by the system can be expressed as
 (1)
(1)

These quantities can be converted into a magnitude scale using the Pogson formula,
 (3)
(3)
where the choice of < fλ|ν > and the zero-point ZP depends on the chosen photometric system, that is, VEGAMAG (Bohlin & Gilliland 2004), ABMAG (Oke 1964), or STMAG (Koornneef et al. 1986).
Synthetic photometry from Gaia XP spectra takes advantage of the particular representation of the spectra itself (a linear combination of a set of analytic basis functions) so that the integrals from Eqs. (1) and (2) can be computed in an extremely efficient way by pre-computing the convolution of the passbands for a given photometric system with the mean spectral basis functions. This functionality is handled by the publicly available GaiaXPy software2. XPSP can be obtained from the Gaia archive3 using GaiaXPy either for filter sets that are already included in the current GaiaXPy release4 or those that are included in the Spanish Virtual Observatory Filter Profile Service5.
Gaia Collaboration (2023a) demonstrated through a comparison with a large set of reliable photometric standards available in the literature (like, e.g., Landolt 2013; Thanjavur et al. 2021; Pancino et al. 2022) that XPSP can reproduce wide-/medium-band photometry with a typical accuracy ≲2% for passbands that are redder than 400 nm, with an accuracy of ≲10% for passbands bluer than 400 nm, and for bright and low-extinction stars. All the SIMBIO-SYS STC and HRIC filters sample portions of the spectrum ≳400 nm and have a full width at half maximum (FWHM) that is wider than the local line spread function (LSF) of the Gaia XP spectra. They therefore appear to be best suited for a calibration with an accuracy of ≃2% with Gaia XPSP, with some special care for the STC_420nm filter, which is at the edge of the critical regime for XP spectrophotometry. The synthetic photometry in the SIMBIO-SYS system obtained from XP spectra and from reference flux spectra can then be compared, for instance, from the CALSPEC6 set of spec-trophotometric standard stars (Bohlin 2020; Bohlin et al. 2020), to derive a simple formula that corrects the residual systemat-ics that affect XPSP. The typical accuracy of the newly produced SIMBIO-SYS standard stars can then be improved to ≤0.1% with respect to the CALSPEC flux scale. A comparable degree of accuracy in synthetic photometry from XP spectra was obtained in Gaia Collaboration (2023a) for some widely used photometric systems by using large sets of photometric standard stars to correct for residual systematics in the XP spectra. This is similar to what we report here using reference spectral libraries.
Our approach used GaiaXPy to obtain XPSP in the SIMBIO-SYS passbands for a suitable set of stars that can be used as photometric standards for the flux calibration of the instrument when it will enter its final orbit of Mercury.
The SIMBIO-SYS photometric system is defined as an AB system, and flux-calibrated Gaia XP spectra are in SI units Wm−2nm−1, hence
 (4)
(4)
(see Gaia Collaboration 2023a, and references therein).
4 Data and methods: Gaia standard synthetic photometry
To obtain synthetic photometry in the SIMBIO-SYS photometric system, we used transmission curves that included the effects of filter passbands, the wavelength-dependent detector quantum efficiency, and the wavelength-dependent optics reflectivity, taken from Deppo et al. (2016) for STC and from Zusi et al. (2019) for HRIC. We plot this in Figs. 1 and 2, respectively.
To trace and eventually correct for residual systematics in the XPSP in the SIMBIO-SYS passbands, we used the calibrated spectra from three different libraries of spectrophotometric standard stars. The set of Gaia Spectro Photometric Standard Stars (SPSS; Pancino et al. 2021) was carefully built up from ground-based spectra to serve as reference for the external calibration of the Gaia photometry and spectrophotometry (Riello et al. 2021; Montegriffo et al. 2023). The SPSS flux scale was shown to lie within ≃1% of the CALSPEC scale, which is taken as ultimate reference (Pancino et al. 2021). We used a preliminary updated version of the library (V3.4; E. Pancino, private communication) that was prepared in view of the upcoming Gaia data release (DR4). The Passband Validation Library (PVL; Pancino et al. 2021) was assembled from a selection of stars from the 2019 version of the CALSPEC sample (Bohlin et al. 2019), with the aim of complementing the SPSS with spectra of stars of extreme spectral types, following Maíz Apellániz & Weiler (2018). Finally, we used the latest version of the CALSPEC library (Bohlin et al. 2020).which is entirely made of space-based spectra and is generally considered as the reference stellar flux scale. We decided to be very conservative in the selection of the stars that we finally adopted as our reference to calibrate the SIMBIO-SYS system. We therefore only kept stars that satisfied the following criteria based on Gaia DR3 quality parameters7:
Stars that were not identified as variable, regardless of the actual amplitude of the variation (phot_variable_flag≠ “VARIABLE”, or as non-single stars (non_single_star=0);
Stars that did not show signs of significant excess noise in their astrometric solution (RUWE<1.5; see Lindegren et al. 2018) or of contamination in their flux measures (C★ <0.1; see Riello et al. 2021).
After we performed these selections on each of the three sets, we created a unique set by adopting the following hierarchy of sources when one star was present in more than one set: CALSPEC, PVL, and SPSS. This resulted in a set of 174 spectrophotometric standard stars, of which 72 were from CALSPEC, 16 from PVL, and 86 from SPSS. The absolute colour-magnitude distribution of the final set of reference spectrophotometric standard stars is shown in Fig. 3. Here and throughout, we denote the Gaia colour GBP − GRP as Bp−Rp for brevity.
We used the CALSPEC stars as our ultimate reference to correct XPSP in the SIMBIO-SYS system, and we used the PVL and SPSS as control samples to check the behaviour of our transformation also in regions of the parameter space (specifically, stellar colour) that may be not well sampled by the CALSPEC set. To compute the corrections that are to be applied to raw Gaia XPSP magnitudes, we used CALSPEC stars with G < 10.5 mag (this is a qualitative threshold to select the faintest starts for which the point spread function could be modelled for the geometric calibration purposes) to correct trends with magnitude and/or colour8 , as this is the relevant magnitude range for SIMBIO-SYS standard stars. These stars span the colour range of −0.53 ≤Bp−Rp ≤ 2.9.
For brevity, we abbreviate in all the plots the names of the SIMBIO-SYS passbands as follows: HRIC is abbreviated with H and STC is abbreviated with S. The F that precedes the wavelength number is dropped, such that, for example HRIC_F550 becomes H550 and STC_F550 becomes S550, HRIC_PAN becomes HPAN, and STC_PAN becomes SPAN.
5 Results
The plots that show the difference between the synthetic magnitudes computed from the spectra of the adopted reference set of spectrophotometric standards (magref) and those computed from Gaia XP spectra (magXP) as a function of G magnitude and Bp–Rp colour, together with the adopted polynomial best-fit curves, are presented and discussed in Appendix A. In general, the residual systematics have a small amplitude that typically lies within the expected ≃2%, except for extreme colours. The adopted corrections have the form of a polynomial up to first degree as a function of G magnitude or up to second degree as a function of Bp−Rp colour. The only exception is the STC_F420 band, for which we adopted a fourth-degree polynomial. We also show in Appendix A that any possible trend with interstellar extinction is removed by the correction for the G and Bp–Rp modelling, meaning that a E(B-V) correction should be a second-order contribution ( at the <<1% level, at least for this sample of stars). We leave this for a future analysis, if more detailed modelling approaches are required.
In Figs. 4, 5, 6, and 7 we show the distribution of the residuals between the XP magnitudes corrected using the equations derived in Appendix A  and the reference magnitudes as a function of G magnitude for G < 10.5 mag. We defined as the accuracy for each passband the average difference between corrected magnitudes from synthetic photometry on the XP spectra and the reference magnitudes, that is, those from the synthetic photometry on reference spectra. We define as the precision the standard deviation of the above differences. In all cases, the accuracy is <0.001 mag, which means that the corrected XP magnitudes in the SIMBIO-SYS system reproduce the CALSPEC flux scale with a mean accuracy better than 0.1%9. The precision depends on the specific passband and ranges from 0.004 mag for HRIC_PAN and STC_PAN to 0.010 mag (for STC_F420). This shows that the corrected XP magnitudes in the SIMBIO-SYS system reproduce the CALSPEC flux scale with a precision ≲ 1.0%. These numbers were computed from the 37 CALSPEC stars with G<10.5 mag, but it can be readily appreciated that SPSS and PVL lie in the same magnitude range and show residuals that are fully compatible with those of CALSPEC stars. The calibrated SIMBIO-SYS photometric system is now defined, once for all, by the corrected XP magnitudes in the SIMBIO-SYS passbands of the standard stars in the SIMBIO-SYS selected fields. The accuracy and precision as defined above are also reported with two significant digits in Table 1.
It is important to note that the accuracy and precision that are reported above were computed under the hypothesis that the transmission curves that we used to derive both magref and magXP through synthetic photometry are the same as the actual transmission curves of the SIMBIO-SYS instrument during its operations. If this were not the case, colour-dependent relations would be required to convert the instrumental magnitudes of the standard stars obtained with SIMBIO-SYS into the calibrated SIMBIO-SYS photometric system. This would be easy in the present case because we can in principle now transform all the Gaia DR3 stars in the relevant magnitude range with XP spectra into standard stars in the SIMBIO-SYS system. Any residual trend between the instrumental and the standard system can therefore be adequately sampled over a very wide range of colours and can be properly corrected.
 |
Fig. 3 Colour-magnitude diagram of the adopted reference set of spectrophotometry standard stars. The G magnitudes are corrected for the distance of the stars. The blue symbols show CALSPEC stars, cyan symbols show PVL stars, and red symbols show SPSS stars. MG is the G magnitude corrected for distance using Gaia DR3 parallaxes (π) with MG =G+5log(π) − 10.0. No correction for extinction was applied as it is relatively low for all the involved stars (E(B-V)<0.13) and is negligible for this purpose. |
 |
Fig. 4 Difference between the synthetic magnitudes from the reference spectra and the corrected synthetic magnitudes from the XP spectra as a function of G magnitude for the reference stars in the magnitude range that is relevant for SYMBIO-SIS standard stars (G < 10.5) for the SIMBIO-SYS STC filters. The pink triangles show SPSS stars, yellow squares show PVL stars, and grey circles show CALSPEC stars. The thick horizontal line marks Δmag = 0.0, and the thin horizontal lines enclose the Δmag = ±0.05 range. The mean and standard deviation of the corrected magnitude difference for the 37 CALSPEC stars with G<10.5 mag is reported in the top right corner of each panel. |
 |
Fig. 5 Difference between the synthetic magnitudes from the reference spectra and the corrected synthetic magnitudes from the XP spectra as a function of Bp−Rp colour for reference stars in the magnitude range that is relevant for SYMBIO-SIS standard stars (G < 10.5) for the SIMBIO-SYS STC filters. The pink triangles show SPSS stars, yellow squares show PVL stars, and grey circles show CALSPEC stars. The thick horizontal line marks Δmag = 0.0, and the thin horizontal lines enclose the Δmag = ±0.05 range. |
Mean difference between the corrected XPSP synthetic magnitudes and those obtained from the reference spectra for the HRIC and STC filters.
6 Discussion
We presented a very simple, straightforward approach to provide accurate magnitudes in the SIMBIO-SYS passbands for Gaia stars, which is to be used for the absolute flux calibration of the camera. To do this, we validated the method for CAL-SPEC, PVL, and SPSS standards and assessed the magnitude-and/or colour-dependent differences between the XPSP-derived and reference synthetic magnitudes. As stated in Sect. 3, our calibrations aimed to remove the residual systematic trends that affect XP spectra, and, consequently, XPSP. The identified trends and their modelling are presented in the appendix. They may originate from systematic errors in Gaia XPSP, such as an over-estimation or underestimation of the flux at specific wavelengths. Huang et al. (2024) provided a more general correction for these systematics as a function of magnitude, colour, and extinction, to be applied to the XP spectrum itself. It is reassuring to note that the effects we corrected for in our specific case are consistent with those modelled and presented in Fig. 11 of Huang et al. (2024) (for further details on the systematics that affect XP spectra, see Montegriffo et al. 2023 and to Huang et al. 2024).
Our modelling allowed us to reproduce the reference photometry with accuracies well below 1 mmag (i.e. better than 0.1%) for all filters and for a precision between 0.004–0.01 mag (i.e. between 0.4% and 1%). We remark, however, that the primary scientific goals of the instruments rely heavily on the panchromatic. Both have accuracies below 1 mmag (i.e. better than 0.1%) and a precision of 4 mmag (i.e. 0.4%). These results can be compared with those from other planetary cameras, although their absolute flux calibration performances are not usually described in detail. Of all possible cameras, we focus on the Colour and Stereo Surface Imaging System (CaSSIS; Thomas et al. 2017) and the Mercury Dual Imaging System (MDIS) Wide Angle Camera (WAC) on MESSENGER Denevi et al. (2017). The first has the same detector as SIMBIO-SYS, and a breakdown of the sources of uncertainties of its flux calibration is available (Thomas et al. 2022). This allows us to compare it meaningfully. The latter provides the most recent imaging data available for Mercury, and a comparison of its data with those from the future SIMBIO-SYS observations will be a key for characterising any surface change. For CaSSIS Thomas et al. (2022) reported an accuracy of 2.8% based on four spectrophotometric standards, Jupiter, and Phobos. The bulk of the uncertainty is given by the standard stars, the Jupiter and Phobos measurements, and the reference spectra, while the detector-level and measurement-specific (i.e. flat field, bias, or background subtraction) uncertainties are negligible (below 0.2%). Denevi et al. (2017) reported the flux calibration of the MDIS/WAC on MESSENGER and presented a precision of 2–5% that was derived from the repeated observation of the same areas under identical illumination and observation conditions. The accuracy was not reported, however. Our accuracy of ≤0.1% and the precision between 0.4 and 1% implies an improvement of a factor ≥28 in accuracy with respect to CaSSIS. When we consider that according to our definitions, our uncertainty on the corrected magnitudes is mainly traced by the precision (due to the removal of the systematic errors), while for CaSSIS, it is all expressed as accuracy, the comparison of the two results in an improvement with a more conservative factor of 2.8–7.0. For MDIS, we obtain a factor of 2–12, with the highest value for the panchromatic filters. This improvement will be pivotal for characterising surface brightness changes on the surface of Mercury that is due to present-day endogenic and exogenic activity, such as hollows, pyroclastic eruptions, or tectonism. Speyerer et al. (2022) reported 20 candidate locations in which surface activity was detected on the basis of the variation in the brightness in MDIS images. Half of them have a significance below 3σ, and just two images are above 5σ. The increased precision by up to ten times in the measured flux by HRIC and STC PAN filters achieved in our approach will enable a much more accurate characterisation of these sites. In addition, it will make SIMBIO-SYS about ten times more precise than MDIS in discovering new sites, thereby providing a novel picture of the current surface processes on Mercury.
The increased accuracy and precision in the flux measurements implied by our results will also provide new grounds for photometric models of the Mercury surface reflection. As shown in Domingue et al. (2016) and Munaretto et al. (2023), current photometric models of Mercury and Hollows reproduce the observations with an accuracy of ≈5%, which is compatible with the uncertainty in the MESSENGER/WAC radiometric calibration. Further improvement in the latter, combined with the additional geometries that will be observable by SIMBIO-SYS, will further refine these models, allowing us to advance our knowledge of the spectrophotometric and microphysical properties of the Hermean surface.
In addition to improving the overall accuracy of the flux calibration, the use of Gaia stars as standards is beneficial for multiple reasons. First, it enables a wide sampling of magnitudes and colours (i.e. spectral slopes), which allows us to fully model the variability in the systematic errors with several possible different reflectance spectra. In this context, the surface of Mercury can be thought of as a solar spectrum with a varying spectral slope that depends on the precise surface mineralogy (Murchie et al. 2019). In particular, the Sun has a Bp−Rp colour of 0.82 (Casagrande & VandenBerg 2018). When we take the variability due to the different spectral reflectance of the Mercury surface into account (Murchie et al. 2019), we can estimate a reasonable variation of ≤10% in the spectral slope. This implies a difference of ±0.1 mags. This interval is fully within the well-behaved part of our calibration. Second, the large number of stars that will be observed will allow us to further increase the flux calibration accuracy. Our estimates are based on 37 CALSPEC stars and can be thought of as upper limits to the accuracies and precision. However, when the SIMBIO-SYS instrument will be operational, it will have all Gaia sources with G < 10 mag, which allows a further improvement. This high number of stars will allow us to model even residual uncertainties and systematics in the pass-band transmission curves. In addition, as a much higher number of stars will be available, even more advanced approaches for modelling the systematics can be attempted: in particular, iterative fittings of a model that includes the combined effect of magnitude, colour, and extinction were presented by Huang et al. (2024); Xiao et al. (2023b) and might be used to further increase the detail of the modelling.
7 Conclusions
We presented a general approach for the absolute flux calibration of a planetary camera that relies on high-quality synthetic photometry from the Gaia mission for stars to be used as photometric standards. While this approach has already been tested and validated for stellar photometry applications (see, e.g. Martin et al. 2024), it has never been used in the context of a multifilter planetary camera. We applied this approach to the SIMBIO-SYS suite of instruments on board BepiColombo, in particular, to the HRIC and STC channels. We selected a database of reference Gaia standards made of CALSPEC, SPSS, and PVL stars. This covered the magnitude and colour ranges that will be observed by SIMBIO-SYS. For these standards, we computed the synthetic magnitudes in the SIMBIO-SYS passbands from both the XPSP acquired by Gaia and from ground-based reference spectra. We compared the two and performed a modelling to correct for residual systematics in the XPSP and reference magnitude. We used CALSPEC stars as reference and the SPSS and PVL as control sample. We quantified the performance of this approach on 37 CALSPEC stars, finding accuracies below 1 mmag (i.e. better than 0.1%) for all filters and a precision between 0.004–0.01 mag (i.e. between 0.4 and 1%) for STC and HRIC. Complete breakdowns of the uncertainties on the radiometric calibration of planetary cameras are rare in the literature, and a comparison is therefore challenging. However, we estimated a very conservative (filter dependent) improvement of a factor 2–7 with respect to TGO/CaSSIS and 2–12 for MESSENGER/MDIS. This improvement will be crucial in characterising the current endogenic and exogenic activity on Mercury. It will allow SIMBIO-SYS to provide an unprecedented view of the surface processes that currently occur on the Hermean surface, including hollows, impact cratering, space weathering, and volcanism. When SIMBIO-SYS will become operational, it will observe many more stars than we considered here. This promises even better calibration opportunities. To conclude, we showed that the availability of large numbers of Gaia stars with a high photometric quality can be exploited for improving the absolute flux calibration of planetary cameras. This represents a step forward with respect to the usual observations of a few standard stars. The large sample of stars considered in our approach and enabled by Gaia allowed us to quantitatively assess any possible colour or magnitude trend, which may be hindered when only a few standard stars are selected. This allowed us to derive improved absolute flux calibration equations, which are pivotal for converting raw data (DN) into physical units. This is beneficial for meeting the scientific aims of these instruments. For SIMBIO-SYS in particular, this highly accurate photometry will allow us to improve the quality of the image mosaics (fewer stitching issues and a more uniform photometric normalisation). In addition, SIMBIO-SYS will be able to provide a baseline on which past MESSENGER data can be recalibrated (the MDIS Narrow Angle Camera channel still lacks a thorough absolute calibration). This aspect is crucial for the quantitative analysis of current and ongoing surface activity on Mercury (Speyerer et al. 2022), and for which SIMBIO-SYS will provide new data after a time span longer than a decade. These radiometric improvements will also provide new ground for the improvement of photometric models of surface reflection, for which current performances are limited by the radiometric accuracy of the instrument, and a characterisation of the Hermean surface photometric and microphysical properties. Finally, the method we presented in this paper might be used and evaluated also for other planetary cameras (i.e., the JANUS10 on board the JUICE11 mission.), which will explore the Solar System in the next years).
Acknowledgements
MM, MB, RS and PM acknowledge the financial support to activities related to the ESA/Gaia mission by the Italian Space Agency (ASI) through contract 2018-24-HH.0 and its addendum 2018-24-HH.1-2022 to the National Institute for Astrophysics (INAF). We gratefully acknowledge funding from the Italian Space Agency (ASI) under ASI-INAF agreement 2017-47-H.0
Appendix A Correction to XPSP magnitudes
In Figs. A.1, A.2, A.3, A.4, and A.5 we show the difference (Δmag) of synthetic magnitudes in the SIMBIO-SYS passbands computed from reference spectra (magref) with their counterparts computed from Gaia XP spectra. Stars from CALSPEC are plotted as grey circles, those from PVL are yellow squares and those from SPSS are pink triangles. Black dashed curves represent the corrections fitted to the CALSPEC subset that is used to correct XP synthetic magnitudes from the residual systematic effects with respect to the CALSPEC flux scale. Corrections as a function of both colour and magnitudes are fitted using 37 CAL-SPEC reference stars lying in the relevant magnitude range for SIMBIO-SYS standard stars, G < 10.5.
In most cases the “raw” XP magnitudes traces their CAL-SPEC counterparts with remarkable accuracy, and, in general, there is excellent consistency also with SPSS and PVL. However we decided to apply corrections also to tiny trends when the data reveal very clearly their systematic nature. For instance, simple colour and magnitude independent offsets < 0.01 mag were sufficient to reduce virtually to zero any residual mean Δmag for the HRIC_PAN and STC_PAN magnitudes. In two cases (HRIC_F880 and STC_F920) one simple linear correction as a function of G magnitude was applied. In all the other cases, except the one will briefly discuss below, a first or second degree polynomial as a function of Bp−Rp colour was sufficient to remove the residual systematics to a satisfactory level. The systematics to be corrected never reach amplitudes ≥ 0.1 mag in the wide colour range covered by our reference stars.
For STC_F420 a fourth order polynomial was adopted to properly correct a trend in colour reaching an amplitude ≳ 0.1 mag for Bp−Rp ≳ 3.0. For Bp−Rp ≳ 2 the trend is traced by only three stars, one two PVL and one CALSPEC, hence this calibration must be used with some caution in this colour range. Still the four stars are compatible with an extremely coherent trend that we ultimately decided to include in our calibration.
The equations required to correct “raw” XP synthetic magnitudes are listed below, where c =Bp−Rp
 (A.1)
(A.1)
 (A.2)
(A.2)
 (A.3)
(A.3)
 (A.4)
(A.4)
 (A.5)
(A.5)
 (A.6)
(A.6)
 (A.7)
(A.7)
 (A.8)
(A.8)
 (A.9)
(A.9)
The general prescription to produce a set of standard stars in the calibrated SIMBIO-SYS systems as defined here is as follows:
select from the Gaia DR3 source catalogue a set of stars that are suitable to be used as SIMBIO-SYS photometric standard stars;
for these stars retrieve from the Gaia archive their G magnitudes and Bp−Rp colours (celestial coordinates and other parameters will be also useful but not strictly needed to derive calibrated magnitudes);
exclude all the stars lying beyond the magnitude and colour limits of validity of the corrections derived above, i.e. 4.2 ≤ G < 10.5 and −0.54 ≤Bp−Rp ≤ 2.912;
retrieve also XP synthetic magnitudes in the SIMBIO-SYS system using GaiaXPy (magXP);
for each star compute and apply the corrections listed above to obtain the final corrected XP magnitudes

When actual SIMBIO-SYS observation of standard stars are performed, it must be checked if the difference between calibrated and instrumental magnitudes show colour trends, that would hint at differences between the tabulated transmission curves we used here and the real ones realised in the instrument on board of the spacecraft. In this case, such colour trends must be corrected for with the proper transformations to convert instrumental magnitudes into the calibrated SIMBIO-SYS system.
 |
Fig. A.1 Difference between synthetic magnitudes from the reference spectra and synthetic magnitudes from the XP spectra as a function of G magnitude (upper panels) and Bp−Rp colours (middle panels) for SIMBIO-SYS HRIC_PAN e STC_PAN. The thick horizontal line marks Δmag = 0.0. Points are colour-coded after the reference set they belong to, pink=SPSS, grey=CALSPEC, yellow=PVL. The mean and standard deviation of the magnitude difference after applying the correction (formula reported on the plot), for the 37 CALSPEC stars having G<10.5 mag, is reported in the top-right corner of upper panels. The correction is plotted in the upper panel if it is a correction as a function of G and in the middle panel if it is a correction as a function of Bp − Rp. The residuals before and after (i.e., difference between synthetic magnitudes from the reference spectra and corrected synthetic magnitudes from the XP spectra) the correction for CALSPEC stars are plotted as a function of extinction E(B-V) in the bottom panel with grey markers and black crosses, respectively. We adopted the E(B-V) values provided by the CALSPEC collaboration (https://www.stsci.edu/hst/instrumentation/reference-data-for-calibration-and-tools/astronomical-catalogs/calspec, data retrieved on September 5, 2024 (Bohlin et al. 2020)). |
 |
Fig. A.2 Same as Fig. (A.1) but for HRIC_F550 and HRIC_F750. The dashed black curves are the polynomial corrections as a function of Bp−Rp, fitted to CALSPEC stars with G < 10.5 mag. |
 |
Fig. A.3 The same as Fig. (A.1) for HRIC_F880 and STC_F420. The dashed black line in the upper left panel is the polynomial of the correction as a function of G for HRIC_F880, fitted to CALSPEC stars with G < 10.5. The black dashed curves are curve in the middle right panel is the polynomial of the correction as a function of Bp−Rp for STC_F420, fitted to CALSPEC stars with G < 10.5 mag. |
 |
Fig. A.4 The same as Fig. (A.1) for STC_F550 and STC_F740. The black dashed curve is the polynomial correction a function fitted to CALSPEC stars with G < 10.5 mag as a function of Bp−Rp. |
 |
Fig. A.5 The same as Fig. A.1 for STC_F920. The black dashed curve in the upper left panel is the polynomial of the correction as a function of G for STC_F920, fitted to CALSPEC stars with G < 10.5. |
References
- Bessell, M., & Murphy, S. 2012, PASP, 124, 140 [NASA ADS] [CrossRef] [Google Scholar]
- Bohlin, R. C. 2020, in IAU General Assembly, 449 [Google Scholar]
- Bohlin, R. C., & Gilliland, R. L. 2004, AJ, 127, 3508 [NASA ADS] [CrossRef] [Google Scholar]
- Bohlin, R. C., Deustua, S. E., & de Rosa, G. 2019, AJ, 158, 211 [NASA ADS] [CrossRef] [Google Scholar]
- Bohlin, R. C., Hubeny, I., & Rauch, T. 2020, AJ, 160, 21 [Google Scholar]
- Brown, A. G. A. 2021, ARA&A, 59, 59 [NASA ADS] [CrossRef] [Google Scholar]
- Casagrande, L., & VandenBerg, D. A. 2018, MNRAS, 479, L102 [NASA ADS] [CrossRef] [Google Scholar]
- Cremonese, G., Capaccioni, F., Capria, M. T., et al. 2020, Space Sci. Rev., 216, 75 [NASA ADS] [CrossRef] [Google Scholar]
- De Angeli, F., Weiler, M., Montegriffo, P., et al. 2023, A&A, 674, A2 [NASA ADS] [CrossRef] [EDP Sciences] [Google Scholar]
- Della Corte, V., Schmitz, N., Zusi, M., et al. 2014, SPIE Conf. Ser., 9143, 91433I [NASA ADS] [Google Scholar]
- Denevi, B. W., Chabot, N. L., Murchie, S. L., et al. 2017, Space Sci. Rev., 214, 2 [Google Scholar]
- Deppo, V. D., Martellato, E., Simioni, E., Naletto, G., & Cremonese, G. 2016, in Modeling, Systems Engineering, and Project Management for Astronomy VII, 9911, eds. G. Z. Angeli, & P. Dierickx, International Society for Optics and Photonics (SPIE), 99111T [NASA ADS] [CrossRef] [Google Scholar]
- Domingue, D. L., Denevi, B. W., Murchie, S. L., & Hash, C. D. 2016, Icarus, 268, 172 [NASA ADS] [CrossRef] [Google Scholar]
- Fukugita, M., Ichikawa, T., Gunn, J. E., et al. 1996, AJ, 111, 1748 [Google Scholar]
- Gaia Collaboration (Prusti, T., et al.) 2016, A&A, 595, A1 [NASA ADS] [CrossRef] [EDP Sciences] [Google Scholar]
- Gaia Collaboration (Montegriffo, P., et al.) 2023a, A&A, 674, A33 [CrossRef] [EDP Sciences] [Google Scholar]
- Gaia Collaboration (Vallenari, A., et al.) 2023b, A&A, 674, A1 [NASA ADS] [CrossRef] [EDP Sciences] [Google Scholar]
- Hapke, B. 2012, Theory of Reflectance and Emittance Spectroscopy, 2nd edn. (Cambridge University Press) [Google Scholar]
- Huang, B., Yuan, H., Xiang, M., et al. 2024, ApJS, 271, 13 [NASA ADS] [CrossRef] [Google Scholar]
- Koornneef, J., Bohlin, R., Buser, R., Horne, K., & Turnshek, D. 1986, Highlights Astron., 7, 833 [NASA ADS] [CrossRef] [Google Scholar]
- Landolt, A. U. 2013, AJ, 146, 131 [Google Scholar]
- Lindegren, L., Hernández, J., Bombrun, A., et al. 2018, A&A, 616, A2 [NASA ADS] [CrossRef] [EDP Sciences] [Google Scholar]
- Maíz Apellániz, J. & Weiler, M. 2018, A&A, 619, A180 [NASA ADS] [CrossRef] [EDP Sciences] [Google Scholar]
- Martin, N. F., Starkenburg, E., Yuan, Z., et al. 2024, A&A, 692, A115 [NASA ADS] [CrossRef] [EDP Sciences] [Google Scholar]
- Montegriffo, P., De Angeli, F., Andrae, R., et al. 2023, A&A, 674, A3 [NASA ADS] [CrossRef] [EDP Sciences] [Google Scholar]
- Munaretto, G., Lucchetti, A., Pajola, M., Cremonese, G., & Massironi, M. 2023, Icarus, 389, 115284 [Google Scholar]
- Murchie, S. L., Izenberg, N. R., & Klima, R. L. 2019, Spectral Analyses of Mercury, eds. J. L. Bishop, J. F. Bell III, & J. E. Moersch, Cambridge Planetary Science (Cambridge University Press), 351 [Google Scholar]
- Oke, J. B. 1964, ApJ, 140, 689 [NASA ADS] [CrossRef] [Google Scholar]
- Pancino, E., Sanna, N., Altavilla, G., et al. 2021, MNRAS, 503, 3660 [Google Scholar]
- Pancino, E., Marrese, P. M., Marinoni, S., et al. 2022, A&A, 664, A109 [NASA ADS] [CrossRef] [EDP Sciences] [Google Scholar]
- Riello, M., De Angeli, F., Evans, D. W., et al. 2021, A&A, 649, A3 [NASA ADS] [CrossRef] [EDP Sciences] [Google Scholar]
- Rothery, D. A., Massironi, M., Alemanno, G., et al. 2020, Space Sci. Rev., 216, 66 [NASA ADS] [CrossRef] [Google Scholar]
- Souchon, A. L., Pinet, P. C., Chevrel, S. D., et al. 2011, Icarus, 215, 313 [NASA ADS] [CrossRef] [Google Scholar]
- Speyerer, E. J., Robinson, M. S., & Sonke, A. J. 2022, Geophys. Res. Lett., 49, e2022GL100783 [CrossRef] [Google Scholar]
- Tan, W., Wang, X., He, H., & Qi, W. 2022, Heliyon, 8, e11776 [NASA ADS] [CrossRef] [Google Scholar]
- Thanjavur, K., Ivezic, Ž., Allam, S. S., et al. 2021, MNRAS, 505, 5941 [NASA ADS] [CrossRef] [Google Scholar]
- Thomas, N., Cremonese, G., Ziethe, R., et al. 2017, Space Sci. Rev., 212, 1897 [NASA ADS] [CrossRef] [Google Scholar]
- Thomas, N., Pommerol, A., Almeida, M., et al. 2022, Planet. Space Sci., 211, 105394 [NASA ADS] [CrossRef] [Google Scholar]
- Thomas, C. A., Naidu, S. P., Scheirich, P., et al. 2023, Nature, 616, 448 [NASA ADS] [CrossRef] [Google Scholar]
- Xiao, K., Yuan, H., Huang, B., et al. 2023a, ApJS, 268, 53 [NASA ADS] [CrossRef] [Google Scholar]
- Xiao, K., Yuan, H., López-Sanjuan, C., et al. 2023b, ApJS, 269, 58 [NASA ADS] [CrossRef] [Google Scholar]
- Xiao, K., Huang, Y., Yuan, H., et al. 2024, ApJS, 271, 41 [NASA ADS] [CrossRef] [Google Scholar]
- Zusi, M., Paolinetti, R., Corte, V. D., et al. 2019, Appl. Opt., 58, 4059 [NASA ADS] [CrossRef] [Google Scholar]
The mean difference between the corrected XP magnitudes and the reference magnitude is much smaller than this (see Table 1). However, this is just the outcome of the very good fit of the correction on a small set of selected reference stars (37), and we therefore take 0.1% as a conservative reasonable reference value for our ability to reproduce the CALSPEC spectrophotometric system as defined by the adopted reference stars. On the other hand, we expect the standard deviation of the difference to be a reliable tracer of the precision.
Jovis, Amorum ac Natorum Undique Scrutator, Della Corte et al. (2014).
All Tables
Mean difference between the corrected XPSP synthetic magnitudes and those obtained from the reference spectra for the HRIC and STC filters.
All Figures
|
Fig. 1 HRIC transmission profiles accounting for optics, filters, and detector QE wavelength-dependent response curves from Zusi et al. (2019). |
| In the text | |
|
Fig. 2 Same as Fig. 1, but for STC from Deppo et al. (2016) |
| In the text | |
|
Fig. 3 Colour-magnitude diagram of the adopted reference set of spectrophotometry standard stars. The G magnitudes are corrected for the distance of the stars. The blue symbols show CALSPEC stars, cyan symbols show PVL stars, and red symbols show SPSS stars. MG is the G magnitude corrected for distance using Gaia DR3 parallaxes (π) with MG =G+5log(π) − 10.0. No correction for extinction was applied as it is relatively low for all the involved stars (E(B-V)<0.13) and is negligible for this purpose. |
| In the text | |
|
Fig. 4 Difference between the synthetic magnitudes from the reference spectra and the corrected synthetic magnitudes from the XP spectra as a function of G magnitude for the reference stars in the magnitude range that is relevant for SYMBIO-SIS standard stars (G < 10.5) for the SIMBIO-SYS STC filters. The pink triangles show SPSS stars, yellow squares show PVL stars, and grey circles show CALSPEC stars. The thick horizontal line marks Δmag = 0.0, and the thin horizontal lines enclose the Δmag = ±0.05 range. The mean and standard deviation of the corrected magnitude difference for the 37 CALSPEC stars with G<10.5 mag is reported in the top right corner of each panel. |
| In the text | |
|
Fig. 5 Difference between the synthetic magnitudes from the reference spectra and the corrected synthetic magnitudes from the XP spectra as a function of Bp−Rp colour for reference stars in the magnitude range that is relevant for SYMBIO-SIS standard stars (G < 10.5) for the SIMBIO-SYS STC filters. The pink triangles show SPSS stars, yellow squares show PVL stars, and grey circles show CALSPEC stars. The thick horizontal line marks Δmag = 0.0, and the thin horizontal lines enclose the Δmag = ±0.05 range. |
| In the text | |
 |
Fig. 6 Same as Fig. 4 for the SIMBIO-SYS HRIC filters. |
| In the text | |
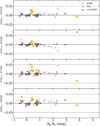 |
Fig. 7 Same as Fig. 5 for the SIMBIO-SYS HRIC filters. |
| In the text | |
|
Fig. A.1 Difference between synthetic magnitudes from the reference spectra and synthetic magnitudes from the XP spectra as a function of G magnitude (upper panels) and Bp−Rp colours (middle panels) for SIMBIO-SYS HRIC_PAN e STC_PAN. The thick horizontal line marks Δmag = 0.0. Points are colour-coded after the reference set they belong to, pink=SPSS, grey=CALSPEC, yellow=PVL. The mean and standard deviation of the magnitude difference after applying the correction (formula reported on the plot), for the 37 CALSPEC stars having G<10.5 mag, is reported in the top-right corner of upper panels. The correction is plotted in the upper panel if it is a correction as a function of G and in the middle panel if it is a correction as a function of Bp − Rp. The residuals before and after (i.e., difference between synthetic magnitudes from the reference spectra and corrected synthetic magnitudes from the XP spectra) the correction for CALSPEC stars are plotted as a function of extinction E(B-V) in the bottom panel with grey markers and black crosses, respectively. We adopted the E(B-V) values provided by the CALSPEC collaboration (https://www.stsci.edu/hst/instrumentation/reference-data-for-calibration-and-tools/astronomical-catalogs/calspec, data retrieved on September 5, 2024 (Bohlin et al. 2020)). |
| In the text | |
|
Fig. A.2 Same as Fig. (A.1) but for HRIC_F550 and HRIC_F750. The dashed black curves are the polynomial corrections as a function of Bp−Rp, fitted to CALSPEC stars with G < 10.5 mag. |
| In the text | |
|
Fig. A.3 The same as Fig. (A.1) for HRIC_F880 and STC_F420. The dashed black line in the upper left panel is the polynomial of the correction as a function of G for HRIC_F880, fitted to CALSPEC stars with G < 10.5. The black dashed curves are curve in the middle right panel is the polynomial of the correction as a function of Bp−Rp for STC_F420, fitted to CALSPEC stars with G < 10.5 mag. |
| In the text | |
|
Fig. A.4 The same as Fig. (A.1) for STC_F550 and STC_F740. The black dashed curve is the polynomial correction a function fitted to CALSPEC stars with G < 10.5 mag as a function of Bp−Rp. |
| In the text | |
|
Fig. A.5 The same as Fig. A.1 for STC_F920. The black dashed curve in the upper left panel is the polynomial of the correction as a function of G for STC_F920, fitted to CALSPEC stars with G < 10.5. |
| In the text | |
Current usage metrics show cumulative count of Article Views (full-text article views including HTML views, PDF and ePub downloads, according to the available data) and Abstracts Views on Vision4Press platform.
Data correspond to usage on the plateform after 2015. The current usage metrics is available 48-96 hours after online publication and is updated daily on week days.
Initial download of the metrics may take a while.